This is a continuation of research of RAM data remanence times. Previous post has the description of goal, methodology and implementation of tool used for this research, as well as some DRAM theory. It is a strongly suggested reading, it should help with understanding the results and the way in which they are presented.
Updates to the testing app
Previous tests showed some inefficiencies of the RAM data remanence tester, caused in big part because of sheer amount of results produced. The only metadata that was saved used to be the (UTC) time encoded in filename, which was just enough to not overwrite old results on consecutive runs, and all other information about hardware, test parameters and environment had to be manually noted elsewhere.
First of the changes added automatic detection of platform name and, after the test finished, asked the user to input temperature and time without the power. There is very little validation of user input, but other than creating another column to saved CSV, there is nothing more that can be done by wrong input. This was deemed to be acceptable for our use case.
Second improvement
added automatic detection of installed DIMM. In theory, it should store all the
information needed to store unique DIMM part number and slot it was installed
in, but it requires SMBIOS data to be properly filled. This exposed
few
Dasharo
issues
that would have to be fixed, otherwise data on affected platforms is incomplete.
Until then, part number of None has to be manually updated in few CSV files.
Last but not least, CSV files are parsed and plots are generated from it with Python script, instead of manually. This saves a lot of time, especially when some part of the diagram has to be modified after a number of plots was already generated. It also has an option to export PNG versions, something that used to be done manually.
With these changes, together with smaller improvements to performance and user experience, we believe that the tool is ready to use outside of our laboratory. Refer to the README in tool’s repository for build and use instructions.
Changes to methodology
With rough idea about what to expect, we slightly modified (or rather specified more precisely) the methodology. As we’ve seen two very different results, we have to somehow decide on time increase between iterations, and when to stop.
Average percentage of bits that changed their value on first iteration (when power was reapplied as soon as possible) is used to decide whether next iterations will be performed with 1 or 10 seconds increase. As a threshold we are using 25% - everything equal or lower will cause 10s increases, and values above that we will use 1s increments.
As a cutoff point, we’re using 49.5%. Results are asymptotically getting closer to 50% with increasing time, but at slower rate with each iteration. Note than for many modules this value was obtained on the first measurement (~0s) already, and no further testing was done in such cases.
We haven’t changed the way measurements were obtained. We still don’t control the temperature, so the same thermometer was used as before for consistency. As for time measurements, the previous result showed either ranges in order of minutes, for which any timer is good enough, or below one second, at which point we can’t switch the power with enough precision anyway.
Tested hardware
We’ve added two new platforms, and extended the list of tested modules to 3 per platform. For each combination, platform was powered off in two ways: by physically cutting the power of running platform, and by gracefully shutting down the platform using UEFI services.
For MSI platforms, physical power off method means flipping the switch on PSU.
Time was counted from when the power LED extinguished, as PSU had enough power
stored in its capacitors that in some cases immediate switching wasn’t enough.
In case of laptops, the battery was disconnected to allow for cutting the power
by removing the power cord, instead of keeping the power button pressed for few
seconds. Cable was removed from the laptop, to avoid impact from any leftover
electricity stored in the cables and power supply. It was also easier to
disconnect than wall plug. This made the time measurements a bit more precise,
although given the results, it probably wasn’t precise enough anyway.
| Platform | RAM modules | Power off method |
|---|---|---|
| NV41PZ |
|
|
| V540TND |
|
|
| MSI DDR4 |
|
|
| MSI DDR5 |
|
|
This gives 24 combinations in total, 2 of which were tested in the previous phase. 2 modules from the same vendor, but with different sizes, and one from another vendor with the same size as the smaller one (to save a bit of testing time) were used for each platform.
Results
Below are raw results from the research. If you’re just interested in comparison between models and power off methods, feel free to skip to the final section of results. For all of the tests, humidity oscillated between 33 and 35%.
In cases where there are more than one result in a series, not all of the charts are shown below. Full results can be found in test-results and parsed with plotter.py from the same repository.
NV41PZ
Both Apacer modules behaved similarly, losing most of the data after about 5 seconds if the platform was gracefully shut down. In case of disconnecting the power, even after reconnecting it immediately, the memory contents were gone on larger one, but maintained for 2 seconds on 4 GB module.
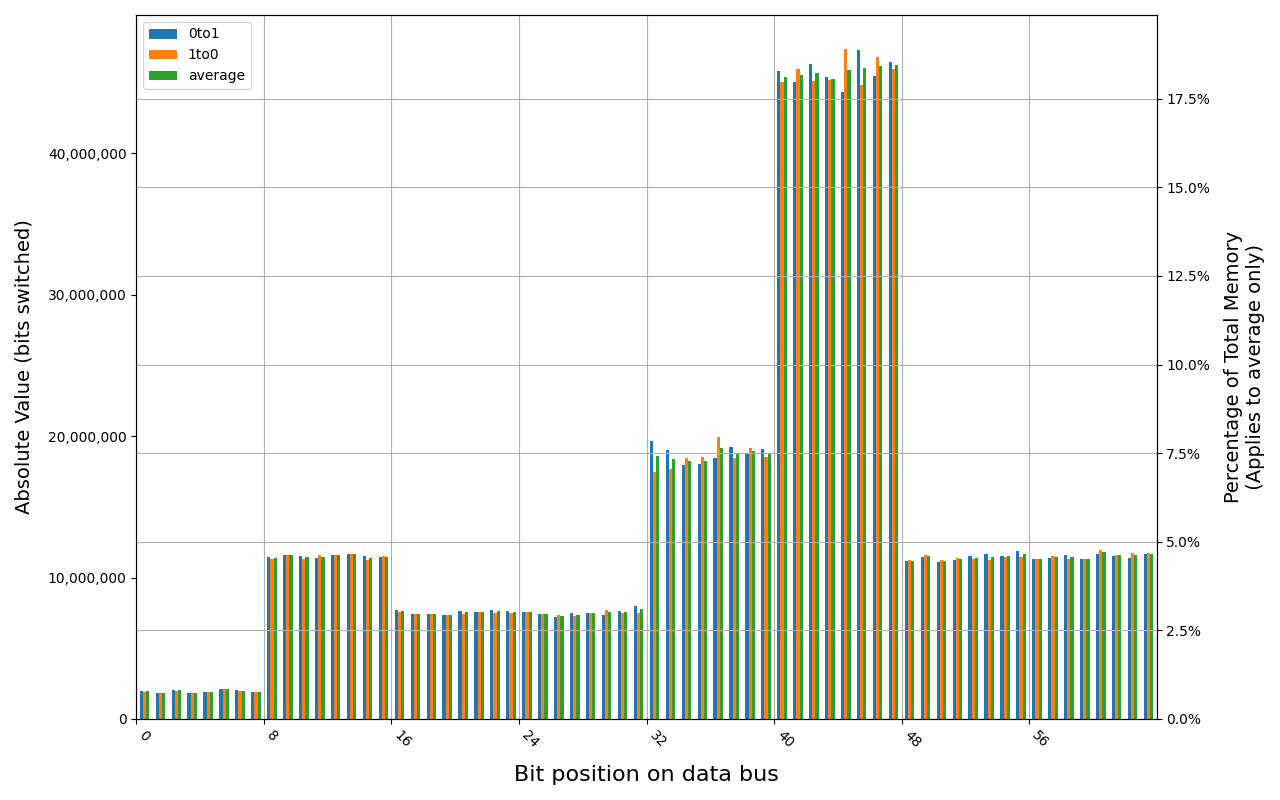
78.B2GFR.4000B, 18.3 ℃, graceful, 0s power off time, 19.46% changed bits 78.B2GFR.4000B, 18.1 ℃, graceful, 2s power off time, 33.48% changed bits 78.B2GFR.4000B, 18.2 ℃, graceful, 5s power off time, 49.71% changed bits 78.B2GFR.4000B, 18.9 ℃, physical, 0s power off time, 8.05% changed bits 78.B2GFR.4000B, 18.9 ℃, physical, 1s power off time, 33.56% changed bits 78.B2GFR.4000B, 18.8 ℃, physical, 3s power off time, 49.93% changed bits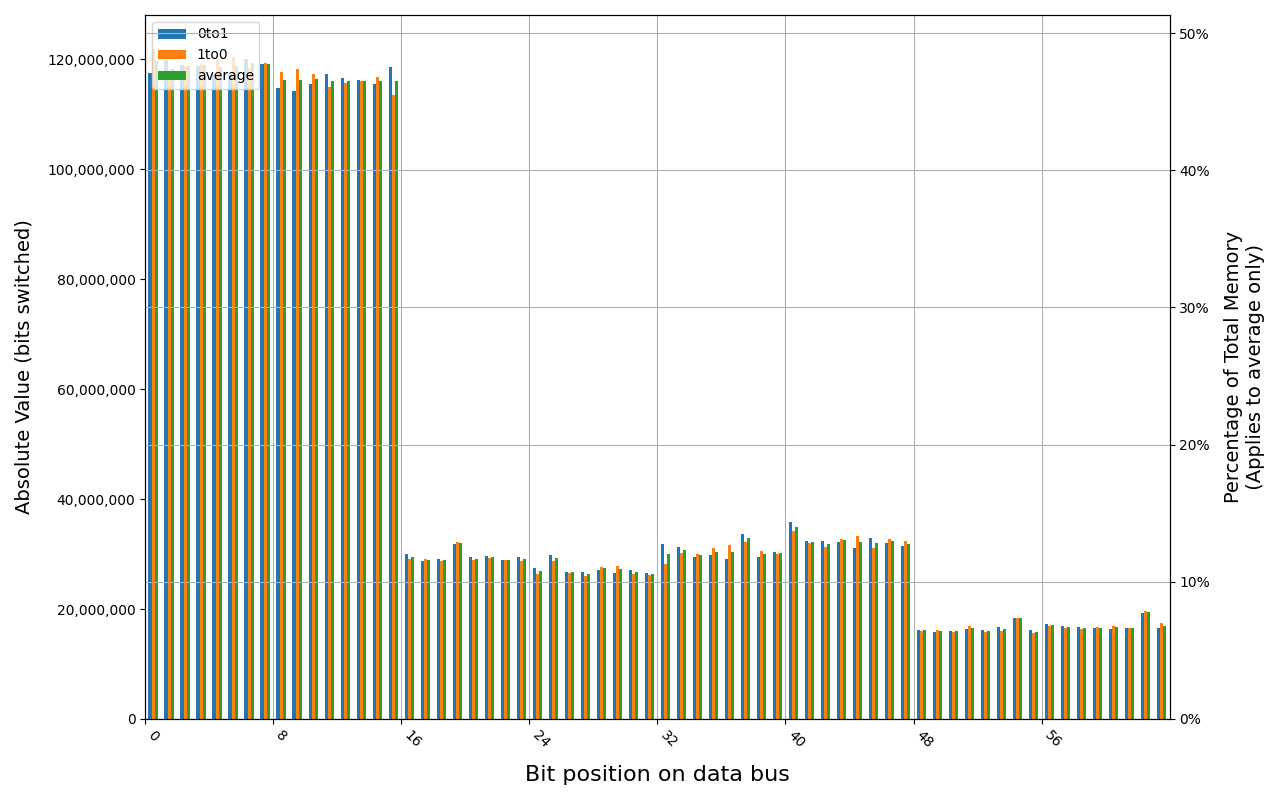
78.D2GG7.4010B, 18.2 ℃, graceful, 0s power off time, 23.99% changed bits 78.D2GG7.4010B, 18.6 ℃, graceful, 1s power off time, 44.98% changed bits 78.D2GG7.4010B, 18.3 ℃, graceful, 4s power off time, 48.14% changed bits 78.D2GG7.4010B, 18.5 ℃, graceful, 7s power off time, 49.76% changed bits 78.D2GG7.4010B, 18.2 ℃, physical, 0s power off time, 48.39% changed bits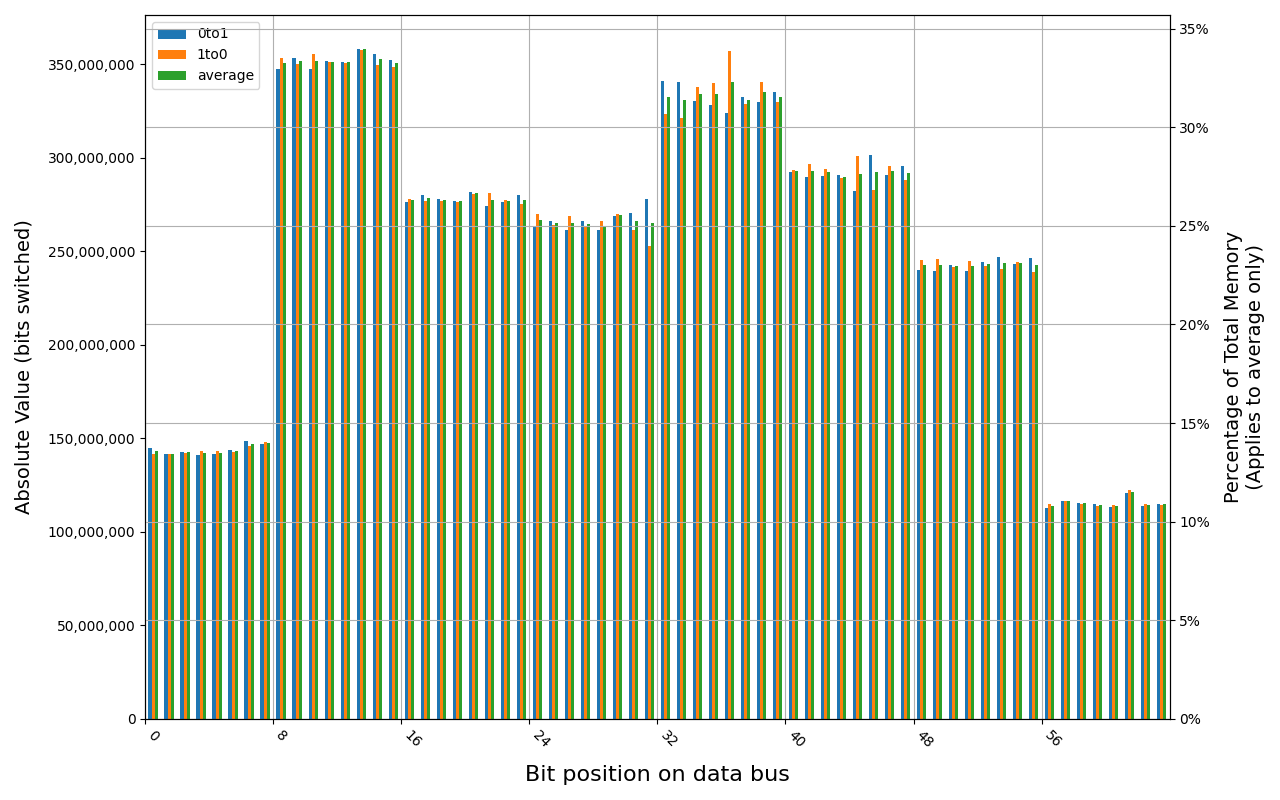

Tigo TMKS4G56ALFBZH-2133P module shows full and immediate loss of data, regardless of method of powering off the platform.
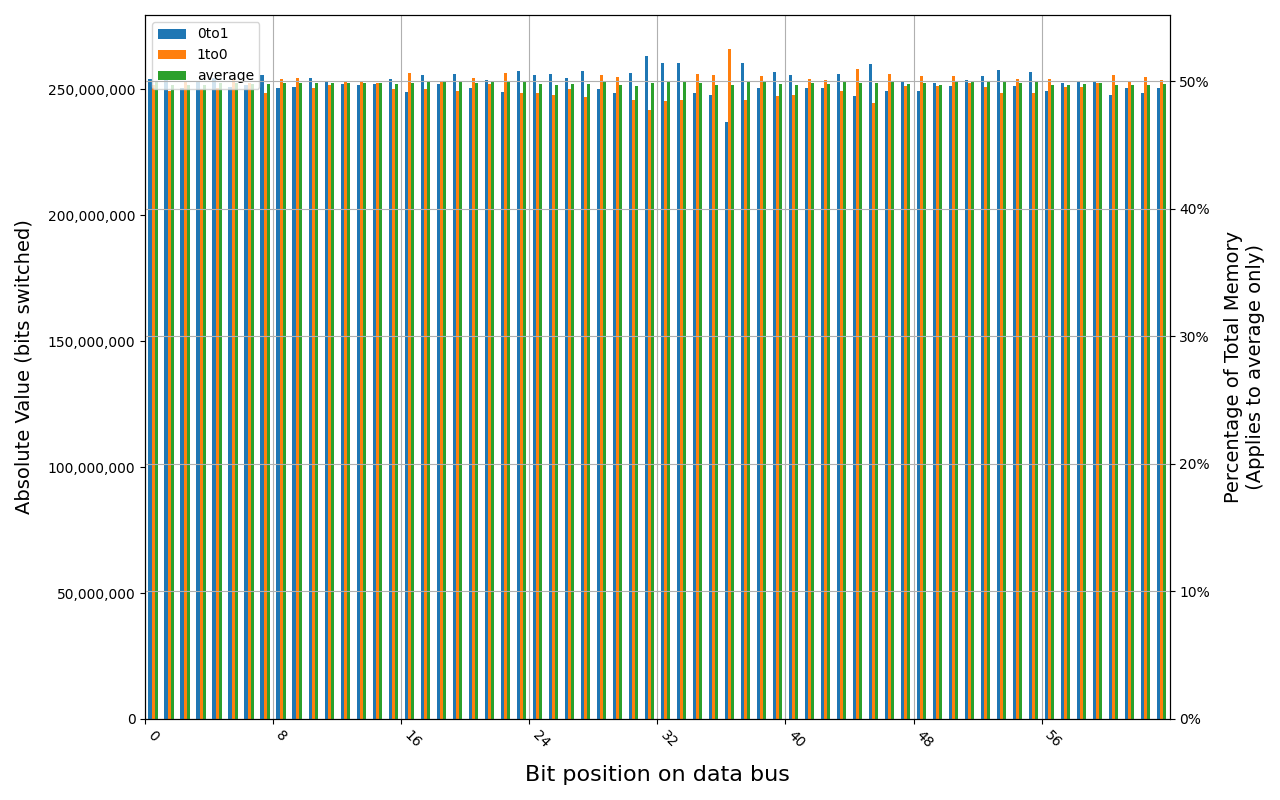
TMKS4G56ALFBZH-2133P, 17.9 ℃, graceful, 0s power off time, 50.01% changed bits TMKS4G56ALFBZH-2133P, 18.0 ℃, physical, 0s power off time, 50.01% changed bits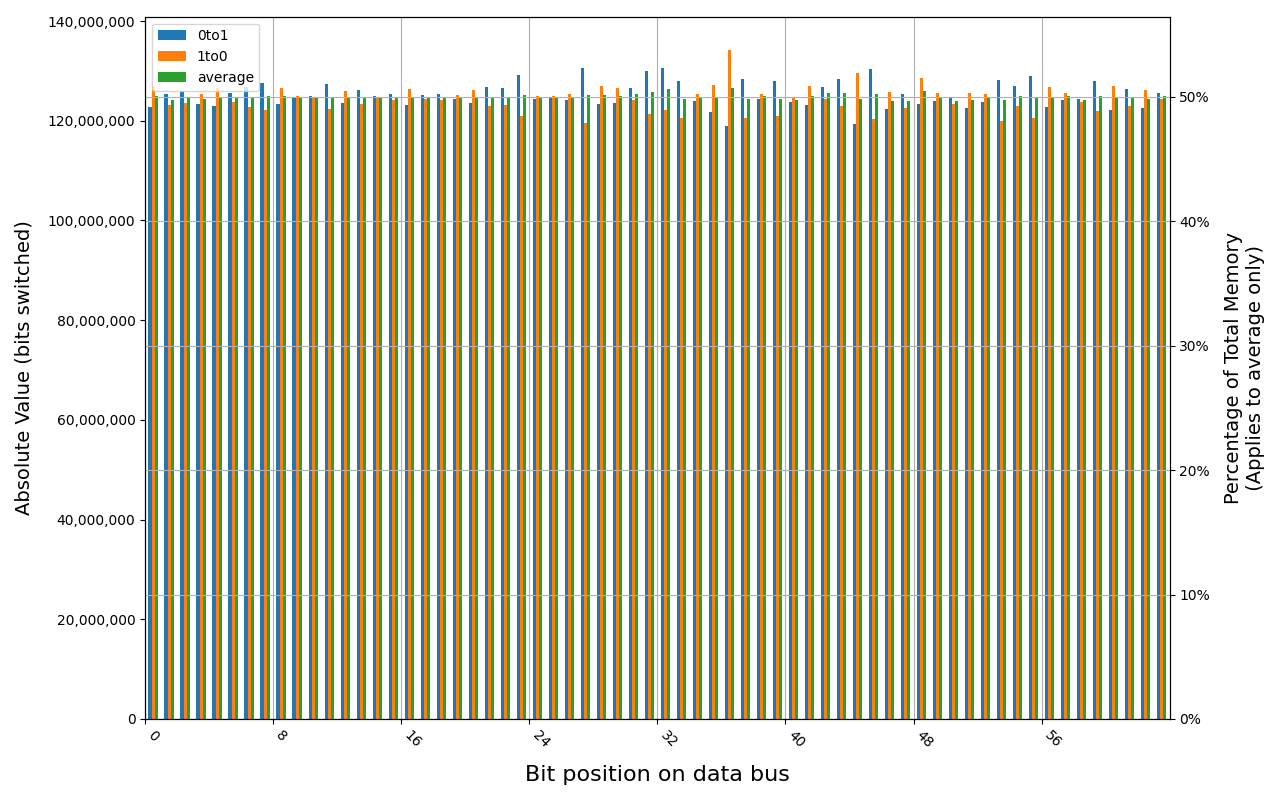
V540TND
W-NM56S508G was tested previously, this time only graceful shutdown was tested. It held a significant amount of data when powered on immediately, but after 1s it was already gone. W-NM56S516G, a bigger variant from the same manufacturer, preserved memory for a while longer, but not by much.
W-NM56S508G, 18.2 ℃, graceful, 0s power off time, 15.46% changed bits W-NM56S508G, 18.3 ℃, graceful, 1s power off time, 49.83% changed bits W-NM56S508G, 18.6 ℃, physical, 0s power off time, 49.72% changed bits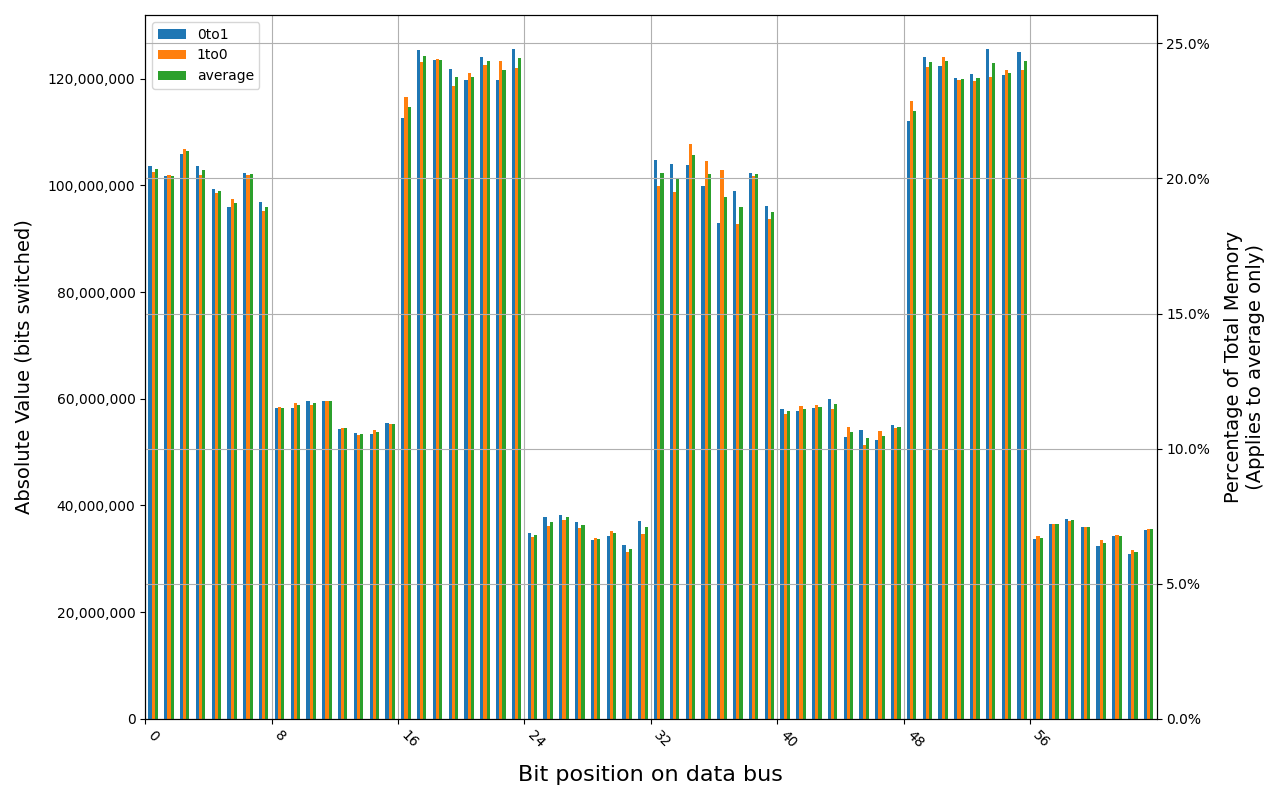
W-NM56S516G, 18.7 ℃, graceful, 0s power off time, 31.35% changed bits W-NM56S516G, 18.5 ℃, graceful, 2s power off time, 45.69% changed bits W-NM56S516G, 18.5 ℃, graceful, 4s power off time, 49.80% changed bits W-NM56S516G, 18.5 ℃, physical, 0s power off time, 42.89% changed bits W-NM56S516G, 18.5 ℃, physical, 1s power off time, 49.81% changed bits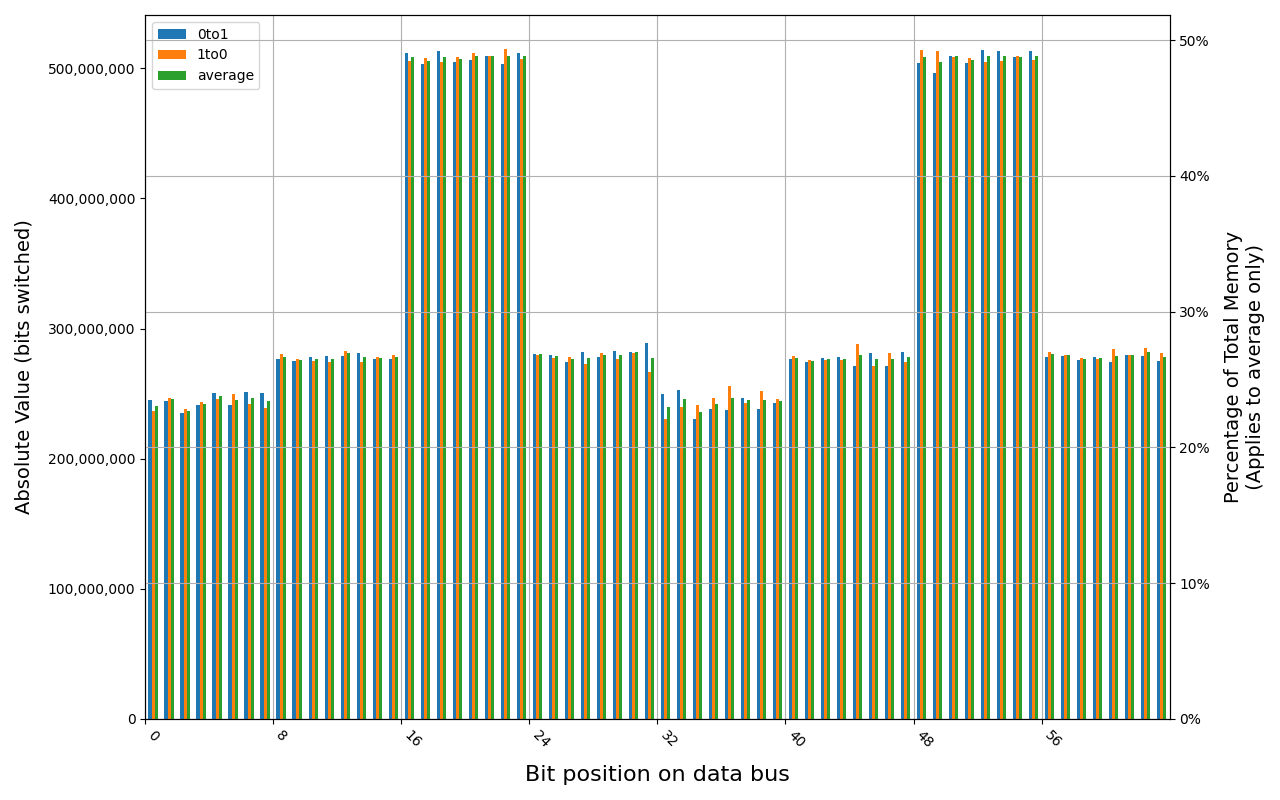
Samsung M425R1GB4BB0-CWMOD module shows full and immediate loss of data in case of forced power cut. Some data was preserved right after graceful shutdown, but it was also gone before 1 second.
M425R1GB4BB0-CWMOD, 18.0 ℃, graceful, 0s power off time, 38.13% changed bits M425R1GB4BB0-CWMOD, 18.2 ℃, graceful, 1s power off time, 50.00% changed bits M425R1GB4BB0-CWMOD, 18.1 ℃, physical, 0s power off time, 49.99% changed bits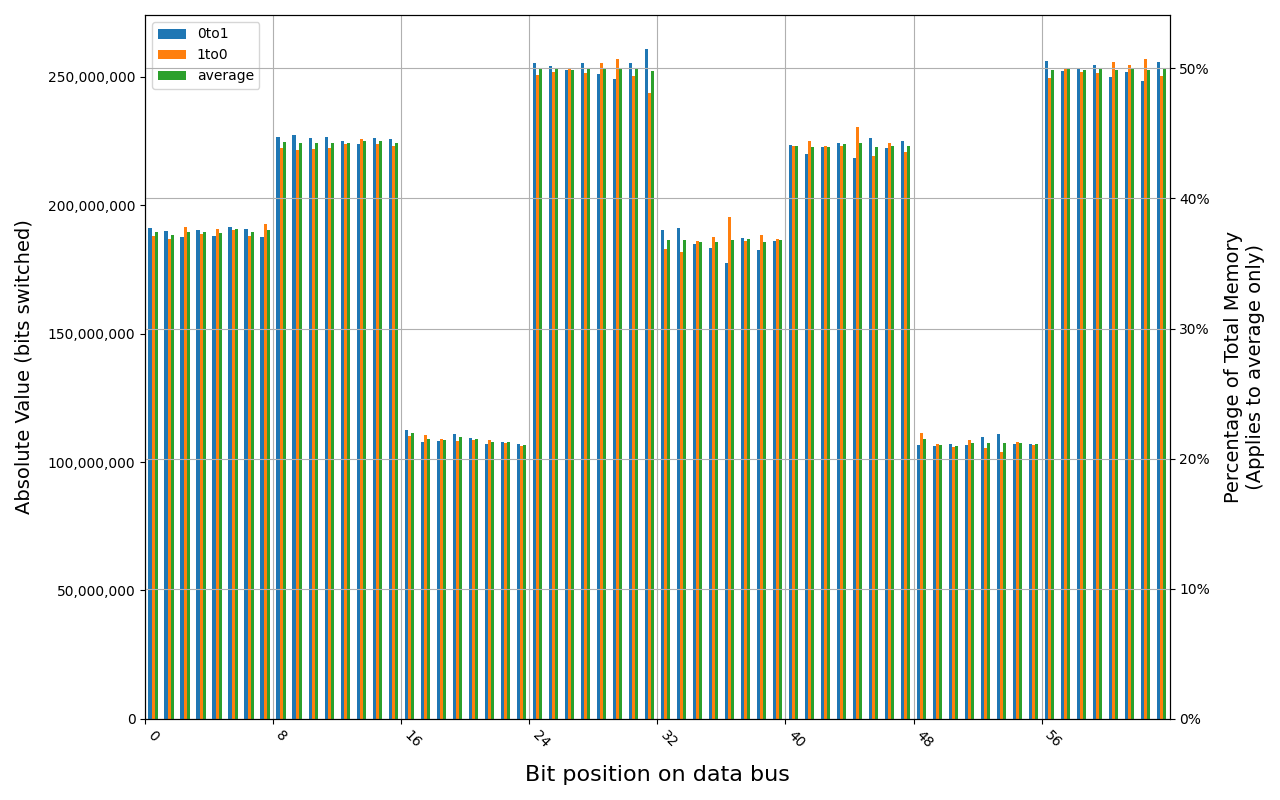
MSI DDR4
4 GB Kingston Fury KF432C16BB/4 module behaved similarly after graceful shutdown as it did for immediate power cut, holding some data for up to 2 minutes.
KF432C16BB/4, 18.8 ℃, graceful, 0s power off time, 0.13% changed bits KF432C16BB/4, 18.9 ℃, graceful, 20s power off time, 5.78% changed bits KF432C16BB/4, 19.0 ℃, graceful, 80s power off time, 47.52% changed bits KF432C16BB/4, 19.1 ℃, graceful, 120s power off time, 49.51% changed bits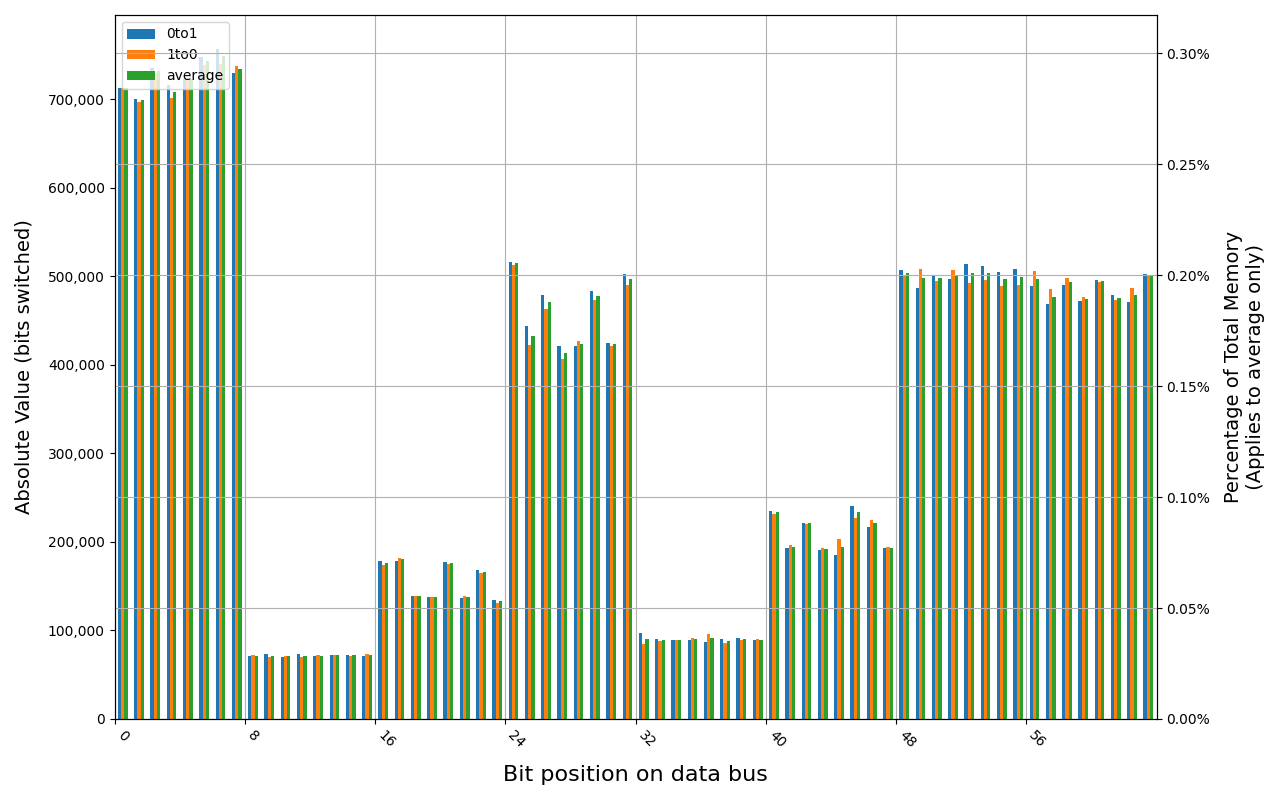
Despite the same vendor, 8 GB Kingston Fury lost all of its data almost immediately. In case of immediate start after a graceful shutdown, 49.49% of bits were changed, which is just below threshold assumed by us as a total loss.
KF432C16BB/8, 18.5 ℃, graceful, 0s power off time, 49.49% changed bits KF432C16BB/8, 18.7 ℃, graceful, 1s power off time, 49.90% changed bits KF432C16BB/8, 18.7 ℃, physical, 0s power off time, 50.00% changed bits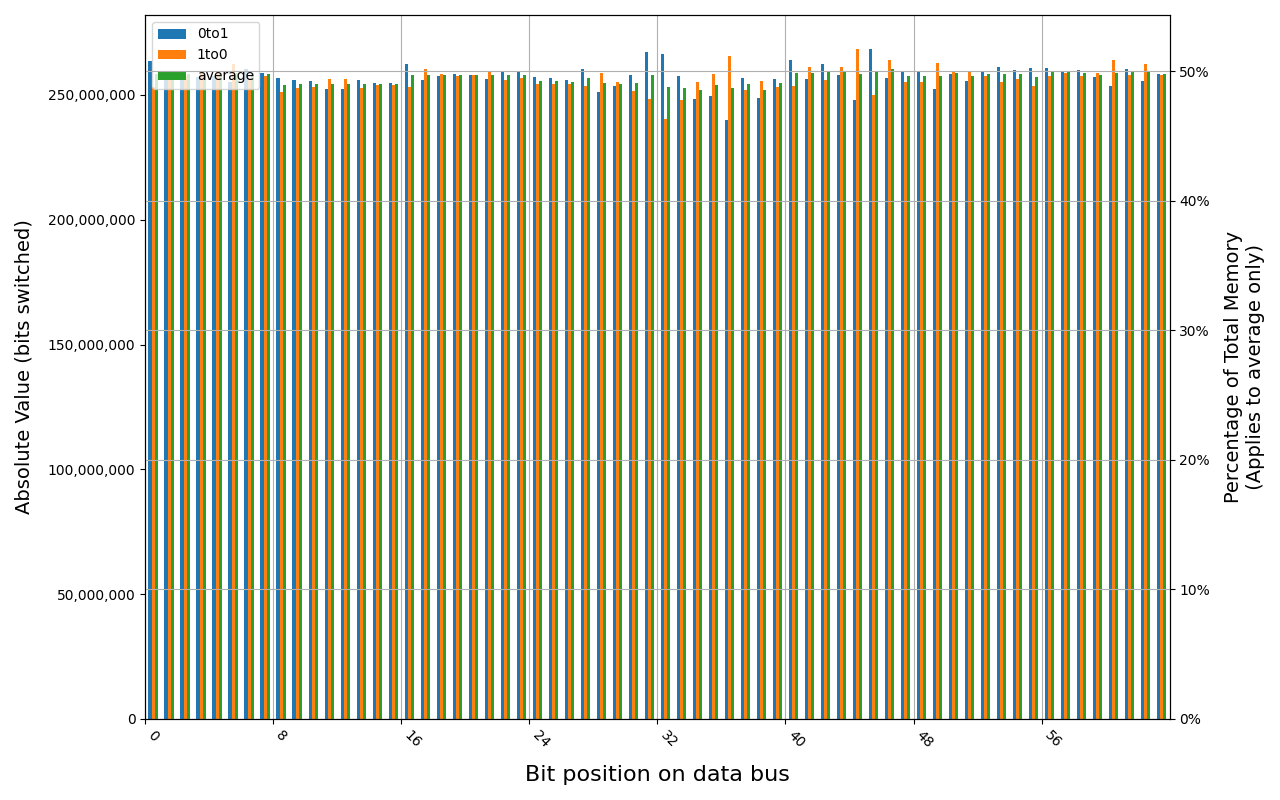
G.Skill F4-2400C15S-4GNT module shows full and immediate loss of data, regardless of method of powering off the platform.
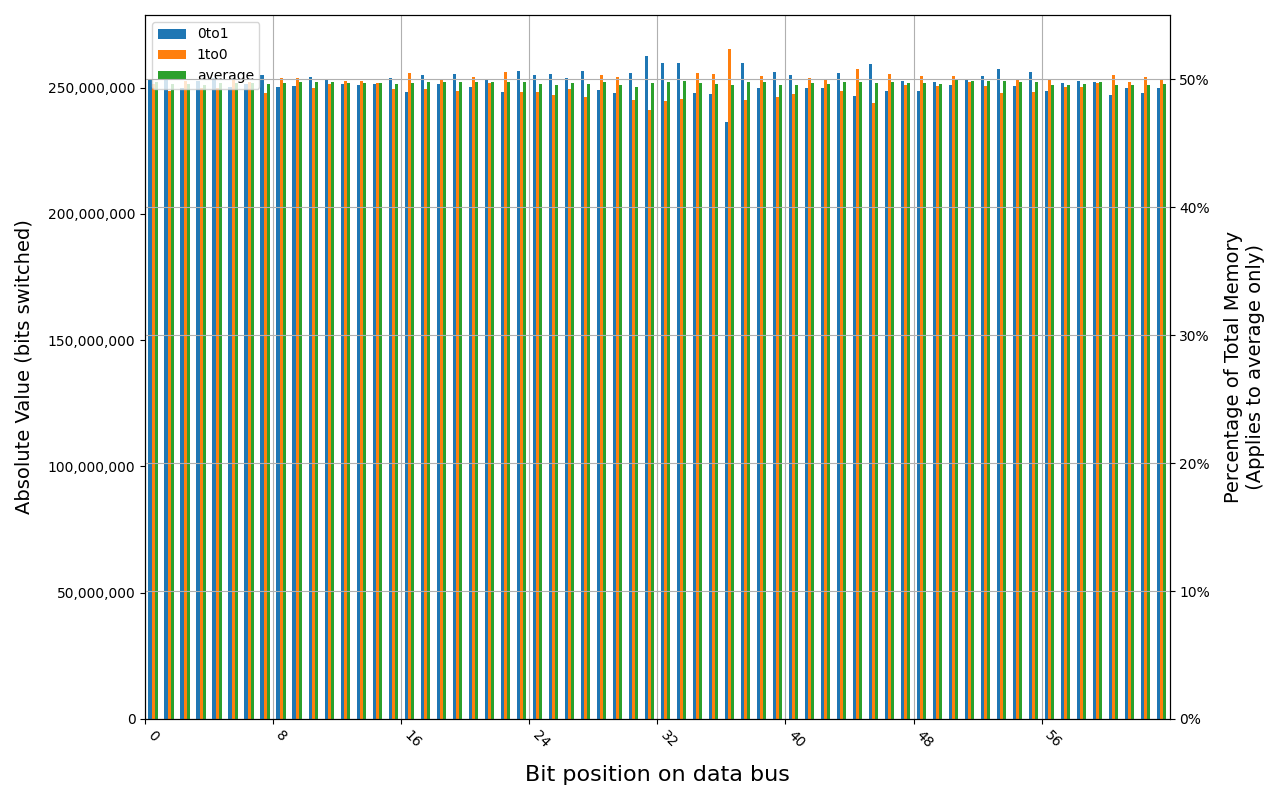
F4-2400C15S-4GNT, 19.1 ℃, graceful, 0s power off time, 49.99% changed bits F4-2400C15S-4GNT, 19.0 ℃, physical, 0s power off time, 49.99% changed bits
MSI DDR5
All of the tested modules show full and immediate loss of data, regardless of method of powering off the platform. A customized firmware with Intel® TME (Total Memory Encryption) disabled was used for these tests.
CT16G48C40U5.M8A1, 18.3 ℃, graceful, 0s power off time, 50.00% changed bits CT16G48C40U5.M8A1, 18.5 ℃, physical, 0s power off time, 50.00% changed bits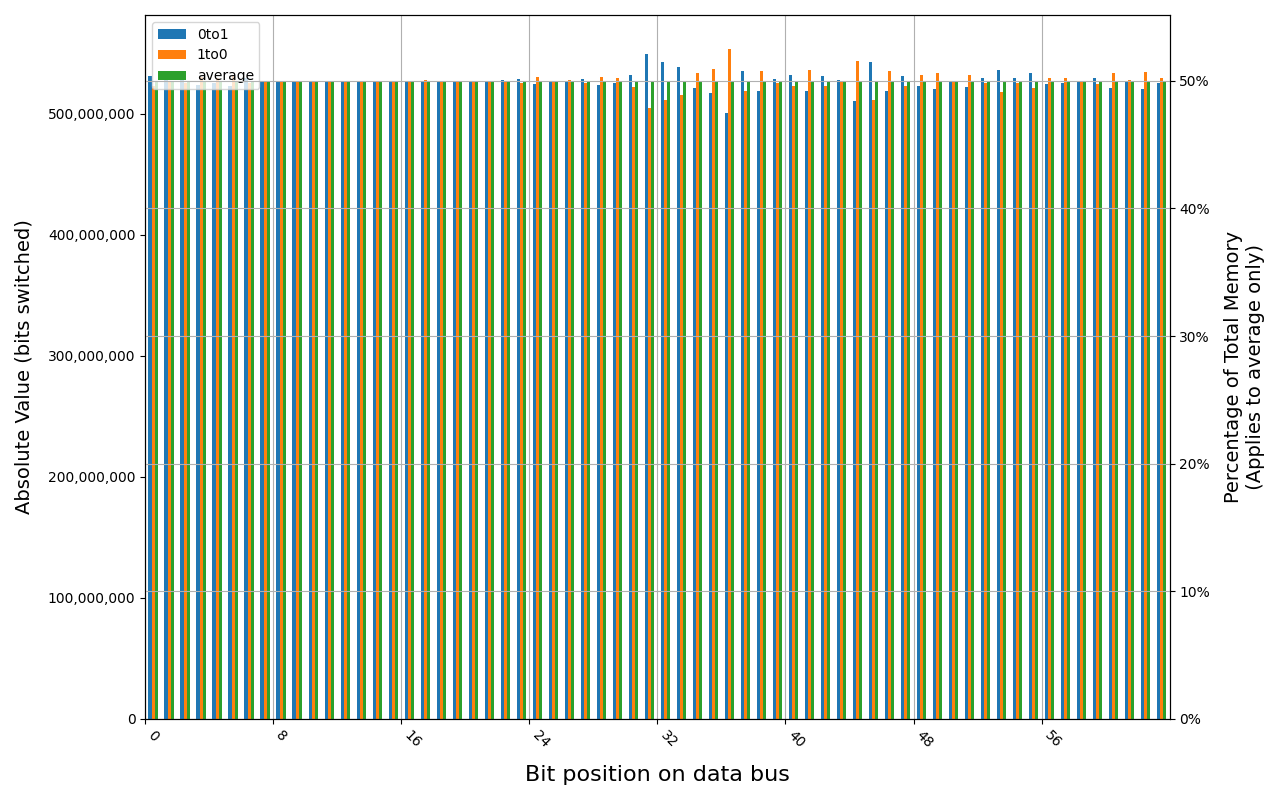

CT8G48C40U5.M4A1, 18.0 ℃, graceful, 0s power off time, 49.98% changed bits CT8G48C40U5.M4A1, 17.8 ℃, physical, 0s power off time, 50.00% changed bits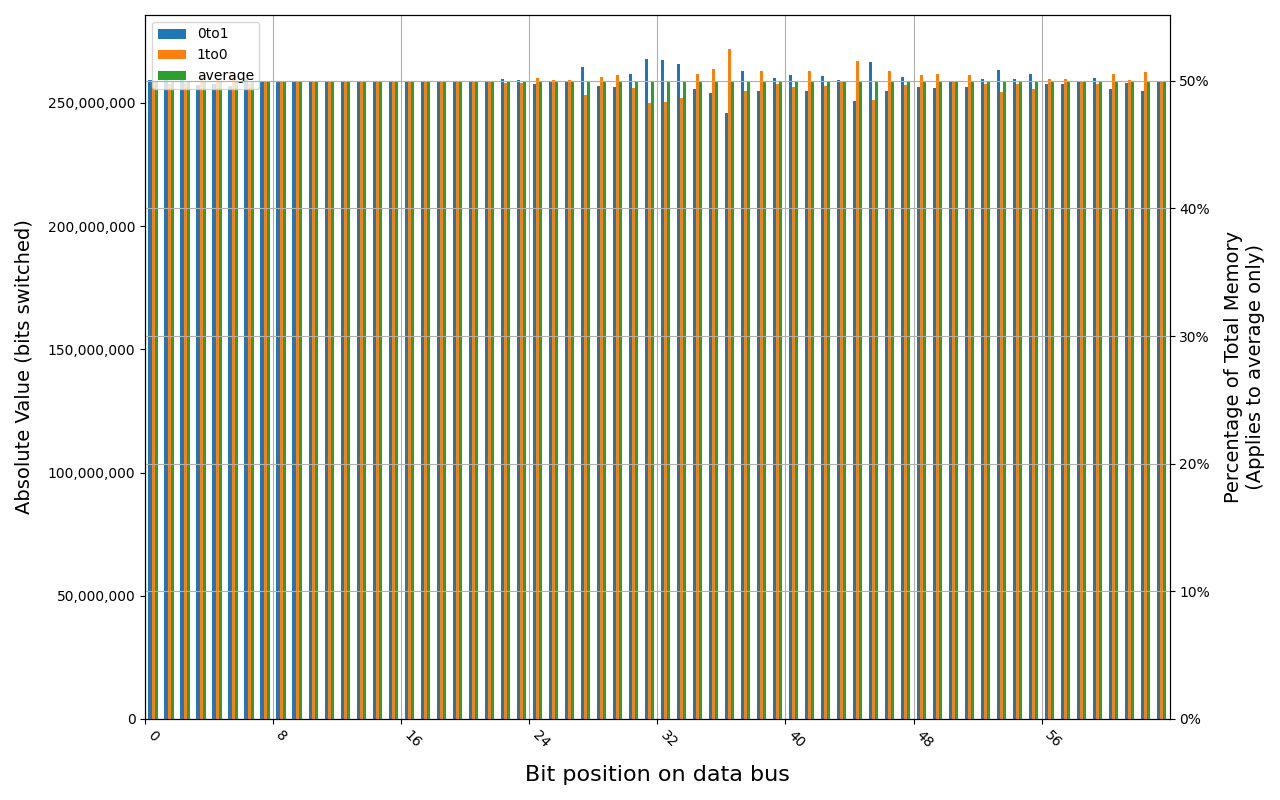

PSD58G480041, 18.2 ℃, graceful, 0s power off time, 50.00% changed bits PSD58G480041, 18.1 ℃, physical, 0s power off time, 50.00% changed bits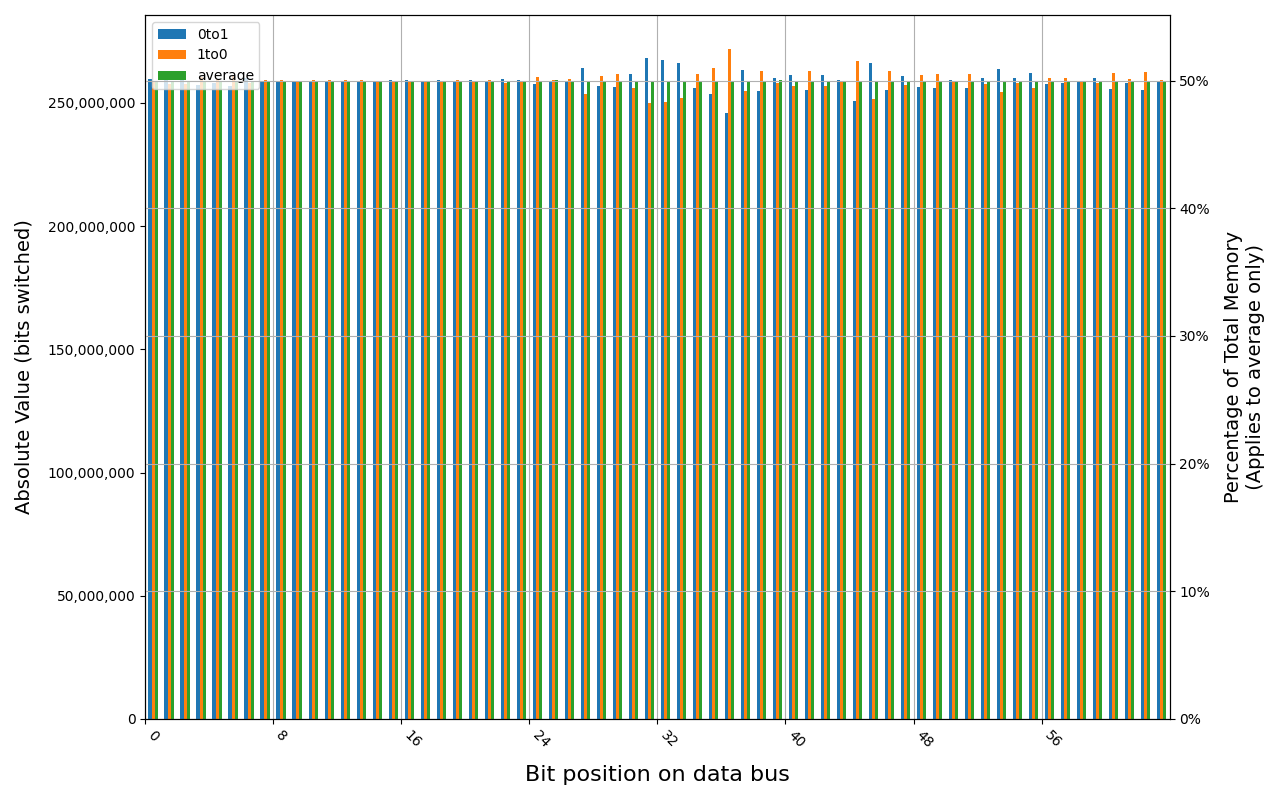

Comparisons
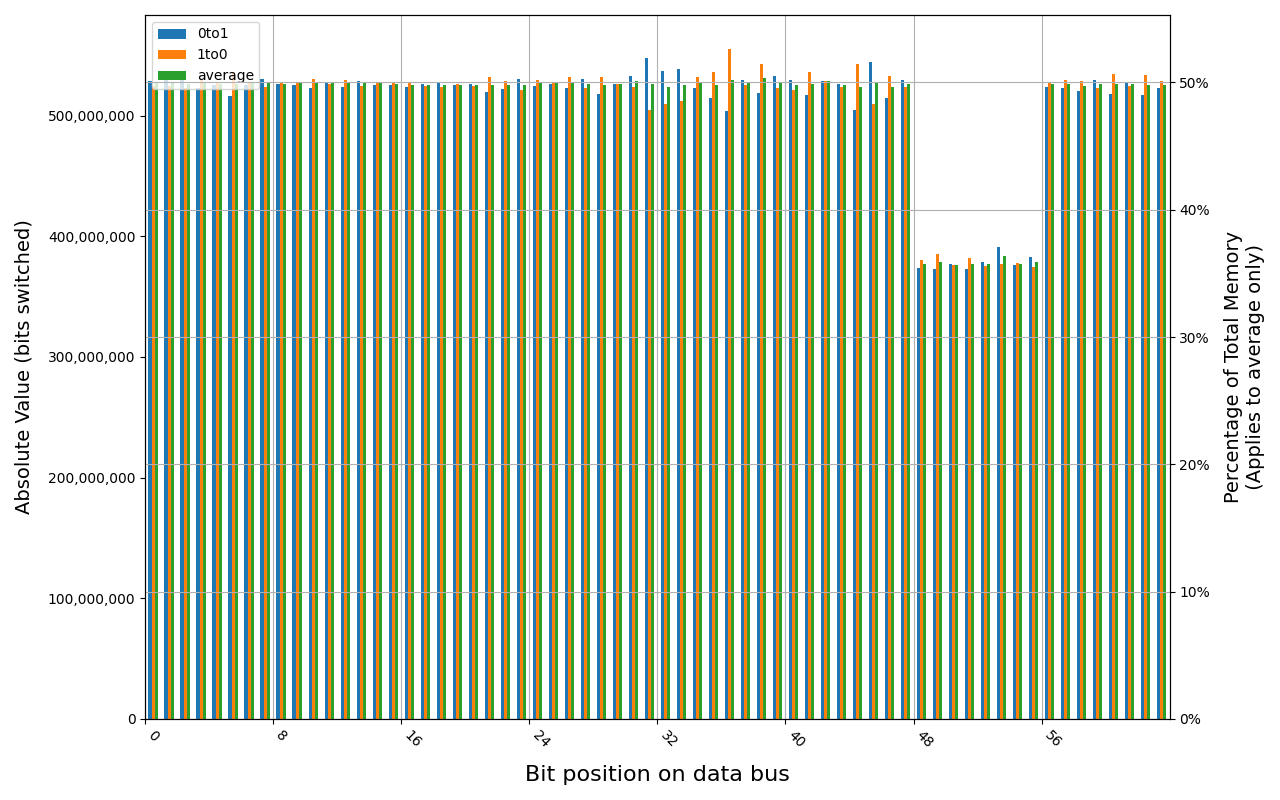
These graphs show comparison between different tests on the same module, or different modules on the same platform. These were prepared only for cases where a high enough number of test points exists.
Even though the temperatures in a given series are relatively constant, there may be a significant difference between separate series. In practice this means that we can’t tell whether the different results are caused by different hardware or temperature, or combination of both. For this reason, legend was omitted from charts to make sure the results won’t be taken out of context.
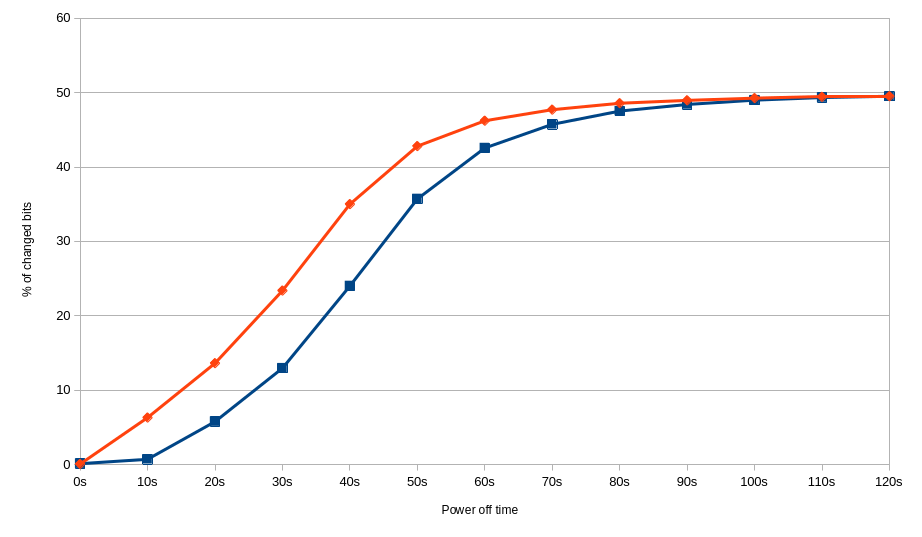
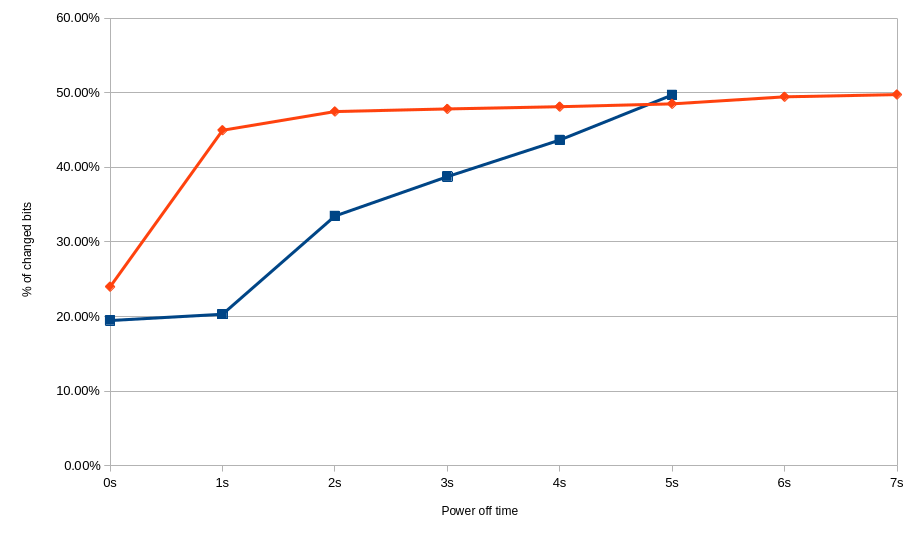
Difference between graceful and forced shutdown in case of KF432C16BB/4. Red - forced shutdown at 18.8-19.2 ℃. Blue - graceful shutdown at 18.8-19.2 ℃
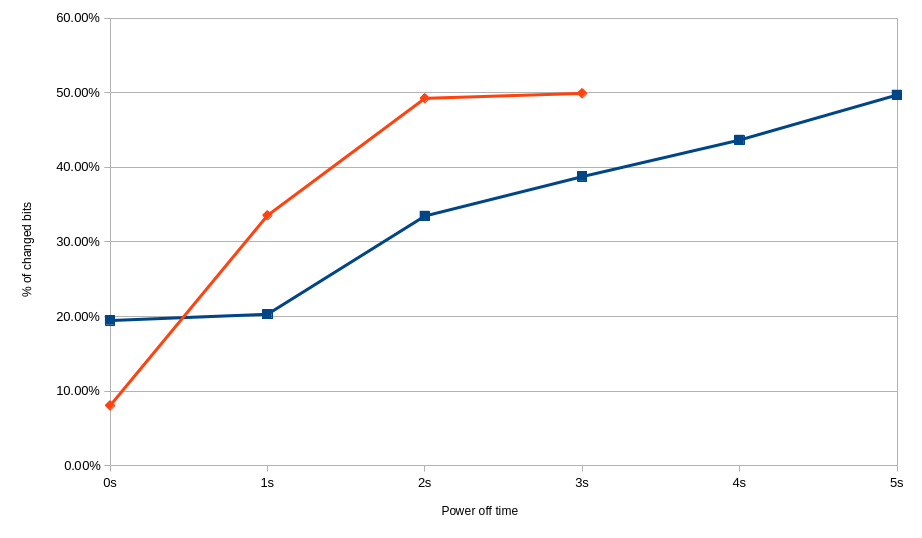
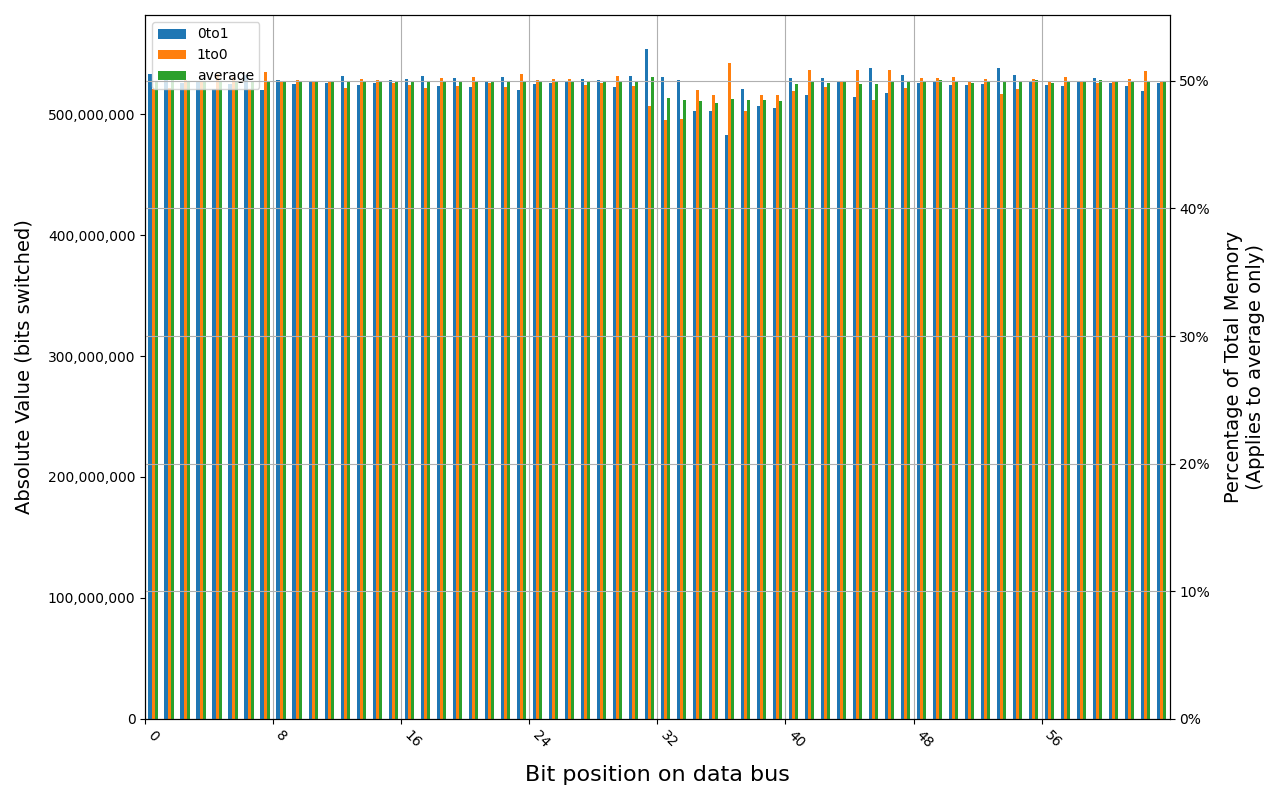
Difference between graceful and forced shutdown in case of 78.B2GFR.4000B. Red - forced shutdown at 18.8-18.9 ℃. Blue - graceful shutdown at 18.1-18.3 ℃
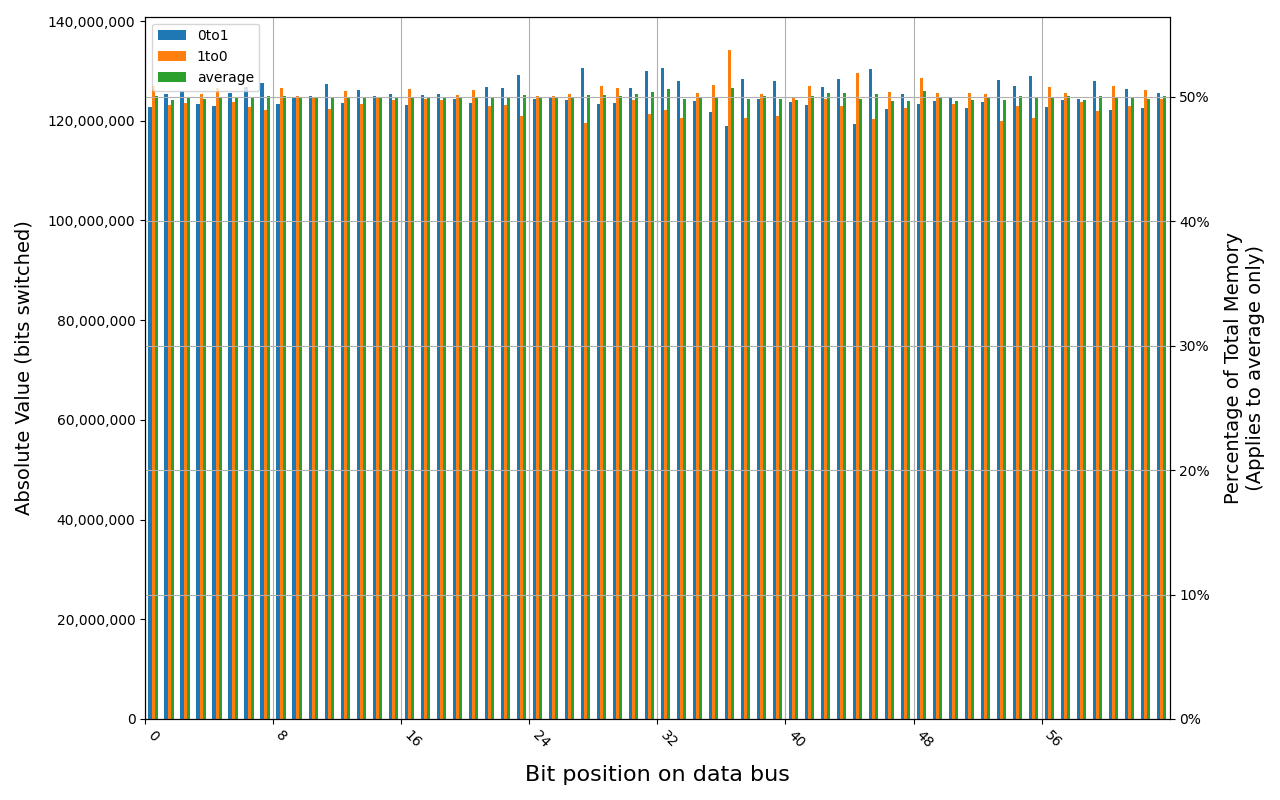
Difference between different sizes of Apacer SODIMMs with graceful shutdown. Red - 78.D2GG7.4010B at 18.1-18.3 ℃. Blue - 78.B2GFR.4000B at 18.2-18.6 ℃
Conclusions
So far, only one of tested modules was capable of holding the data for more than a few seconds, by a huge margin. Interestingly, a bigger module from the same family was not capable of doing the same.
DDR4 on laptops seems to retain data for longer time than DDR5, however, it may be impacted by other factors. For example, DIMM slots are located closer to the CPU in DDR5 laptop. It also has a dedicated graphics card, which is another source of heat.
Data on tested PC DDR5 modules is lost immediately, contrary to tested DDR4 modules. Those modules were produced by different vendors, which may also impact the results. If we eliminate the module on which data survives for whole 2 minutes, the times for remaining DDR4 modules are just barely longer than those on DDR5.
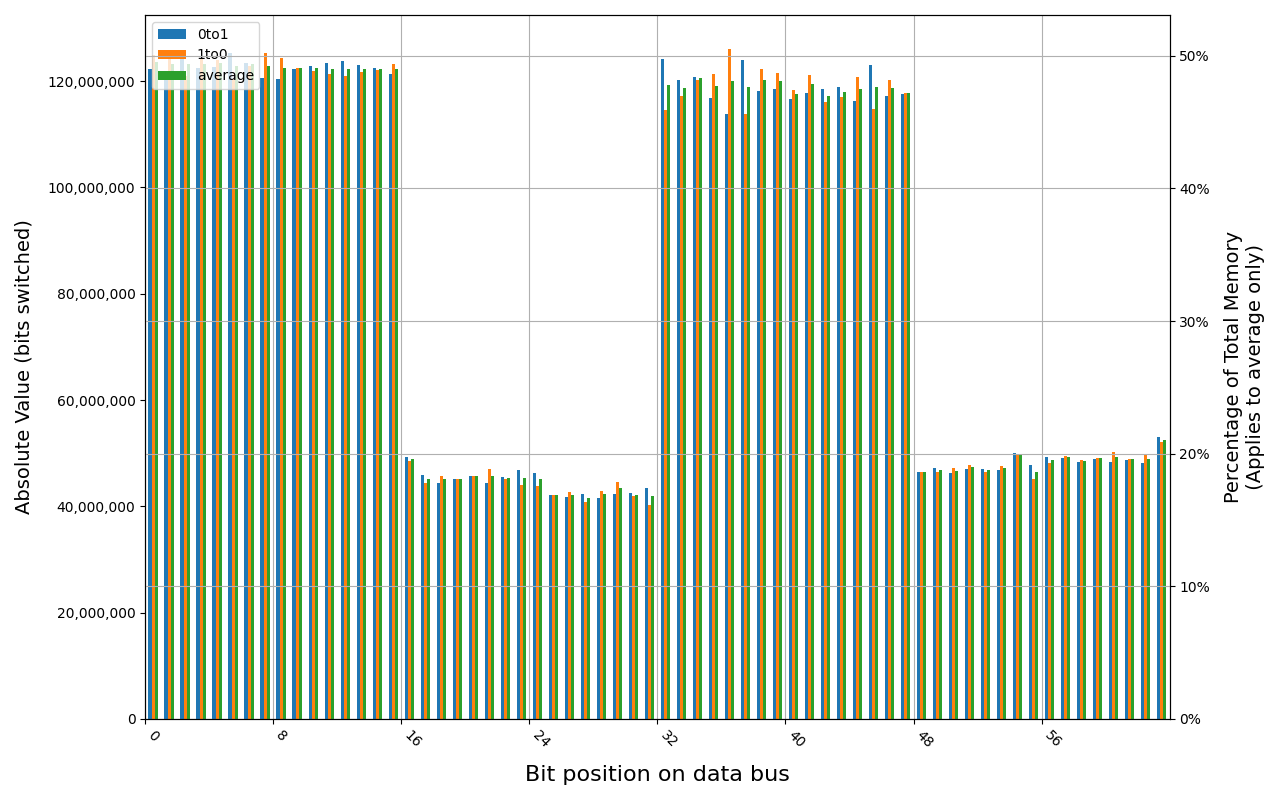
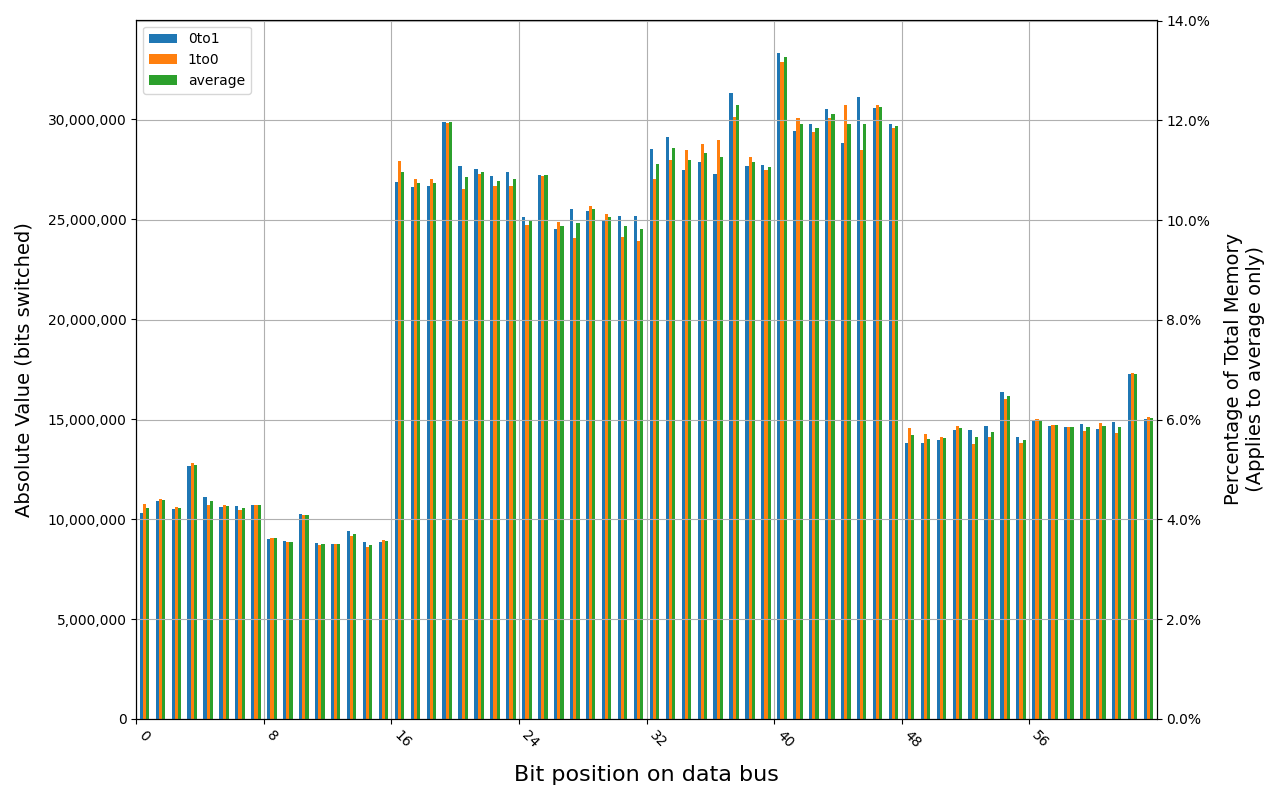
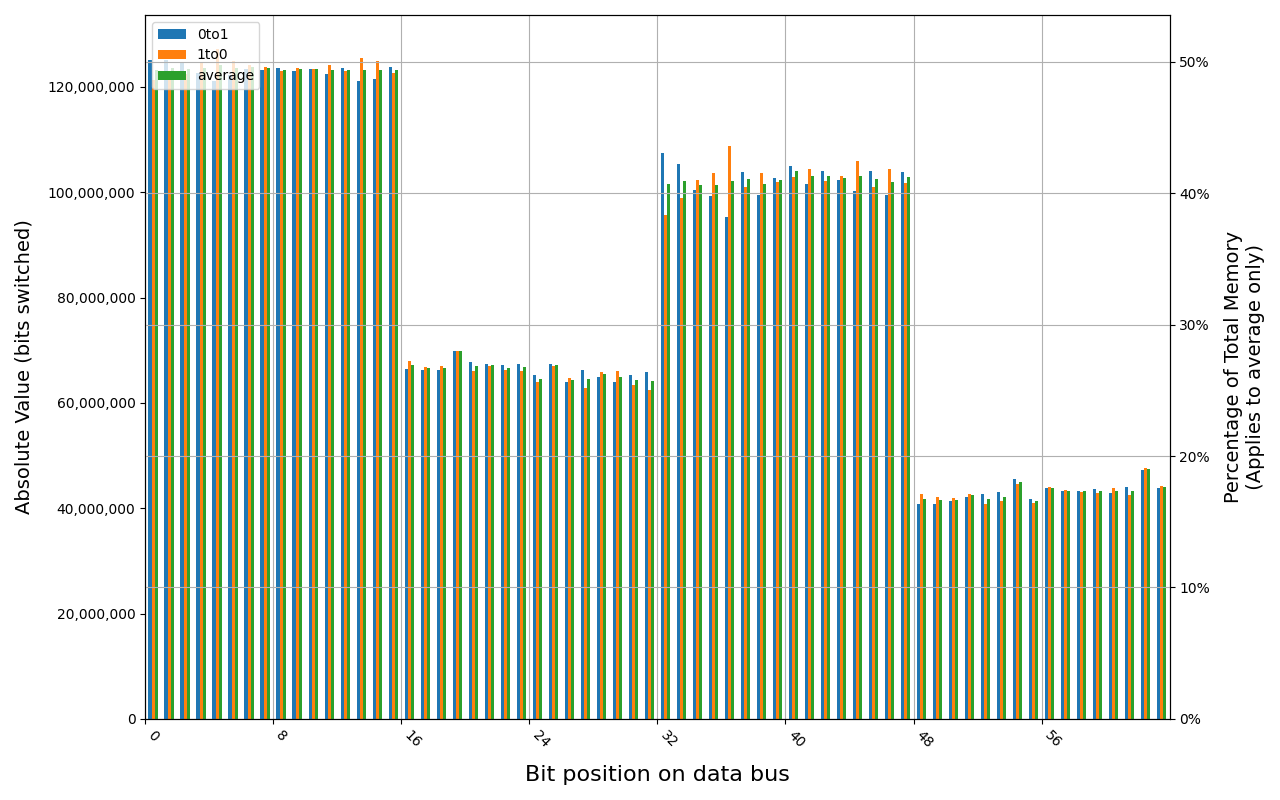
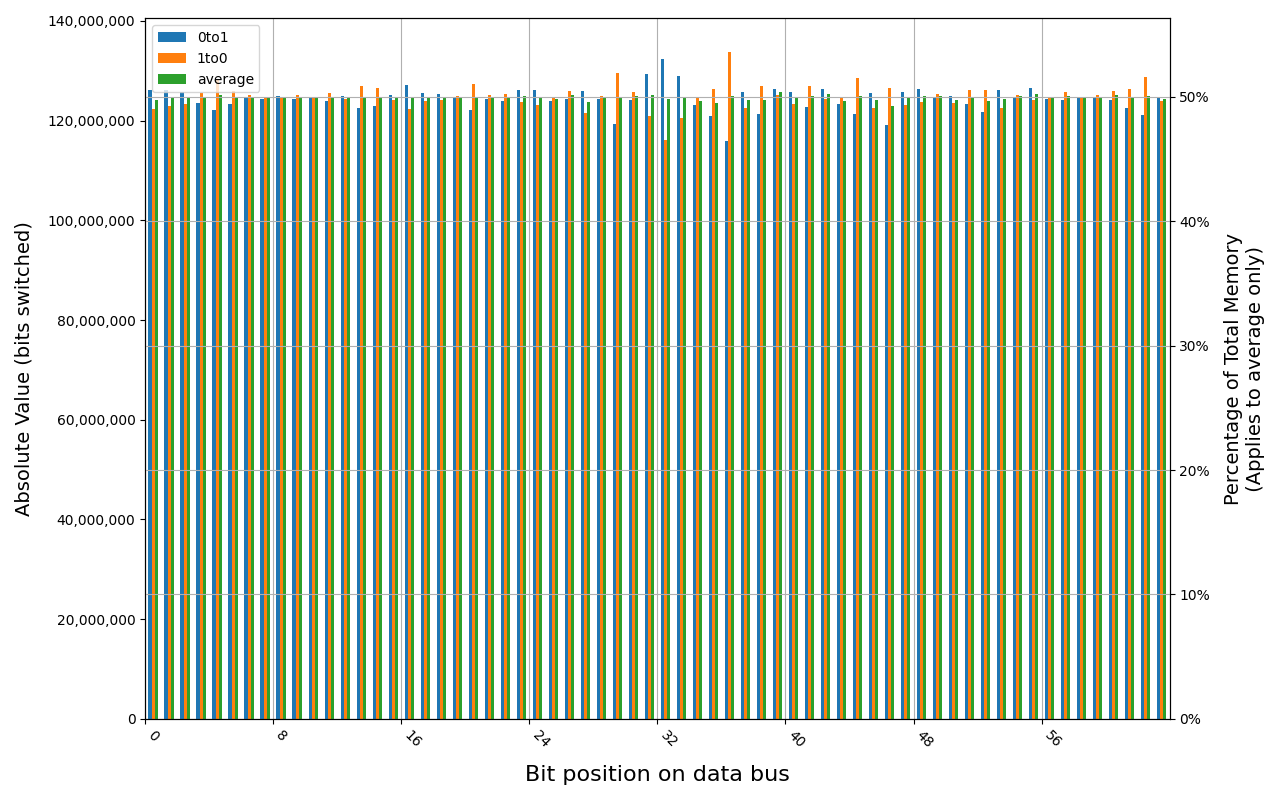
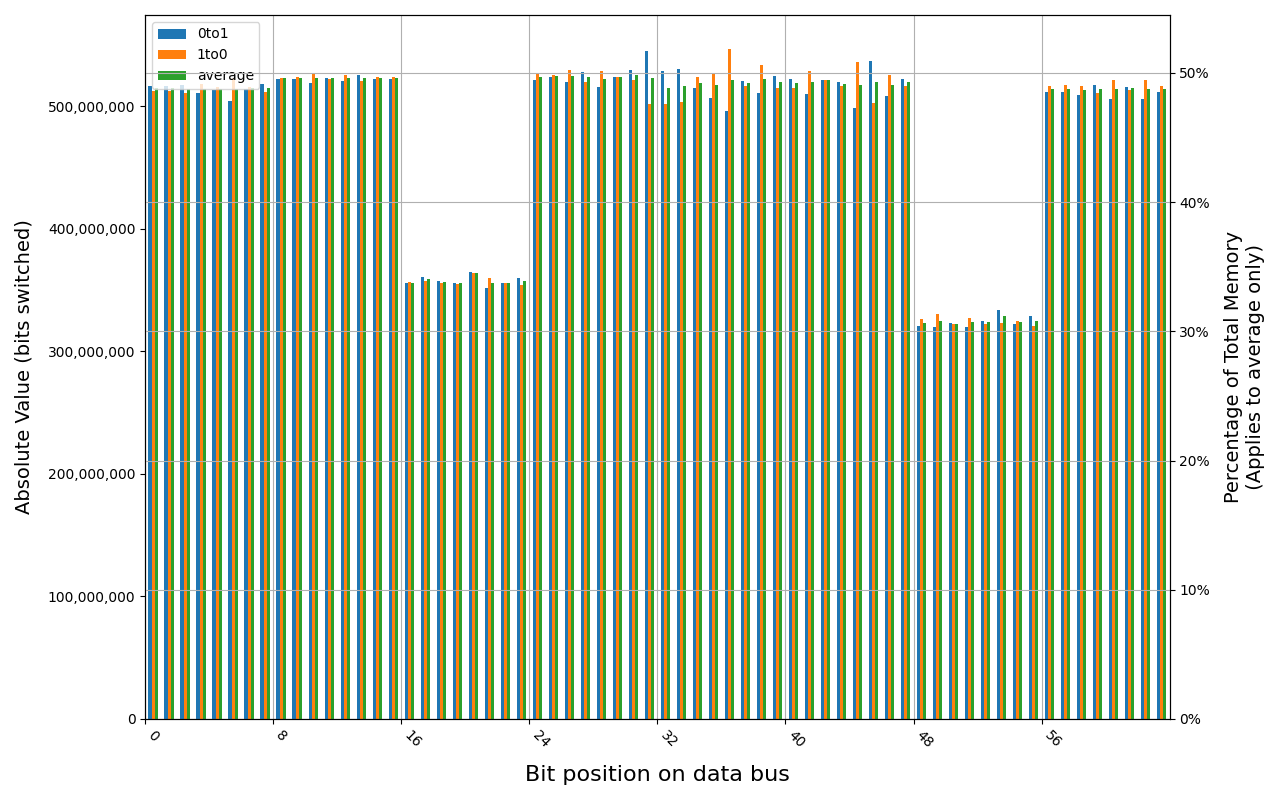
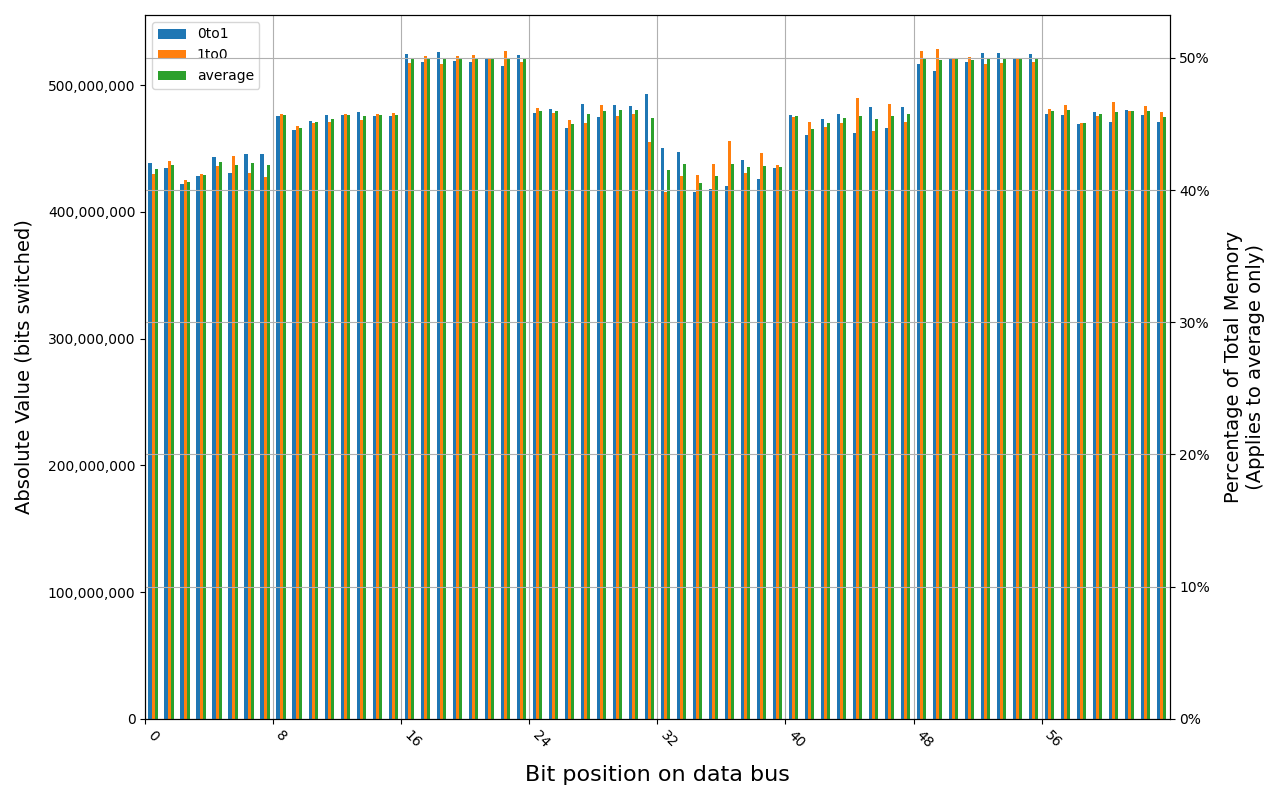
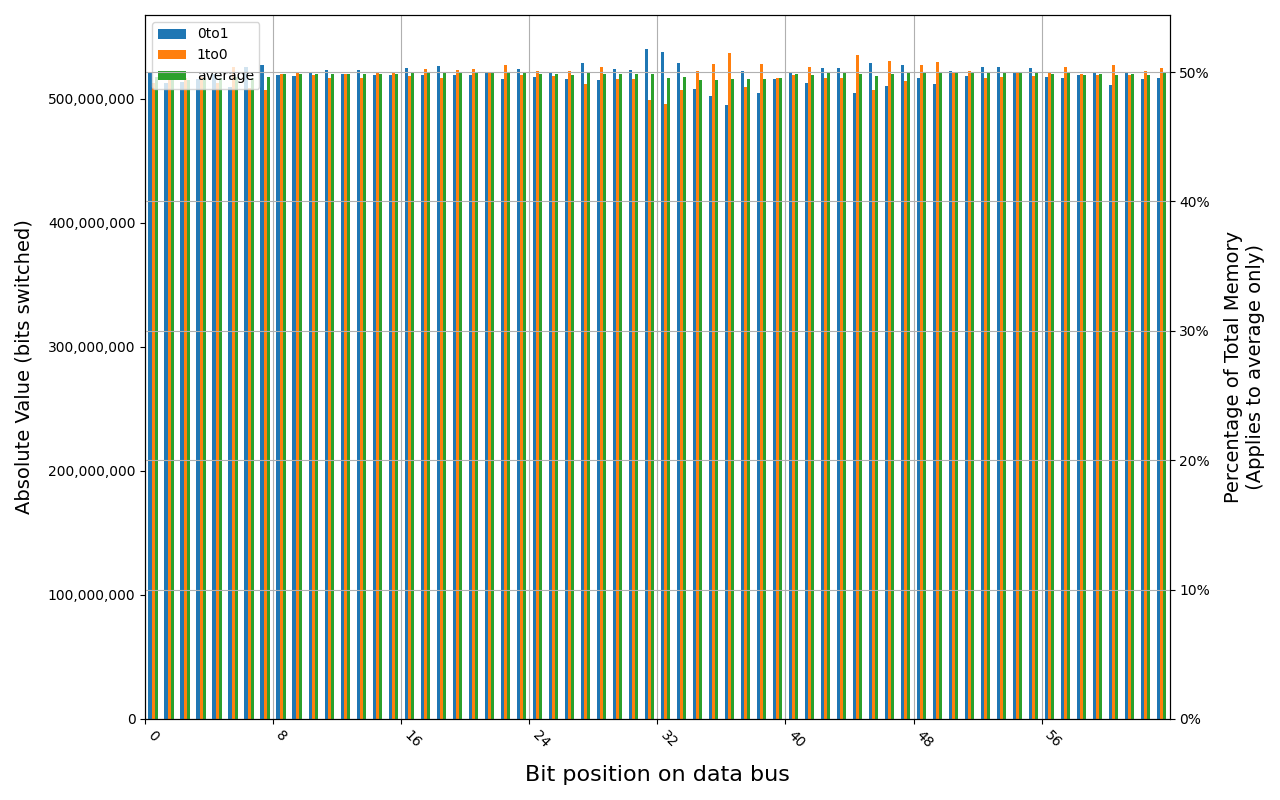
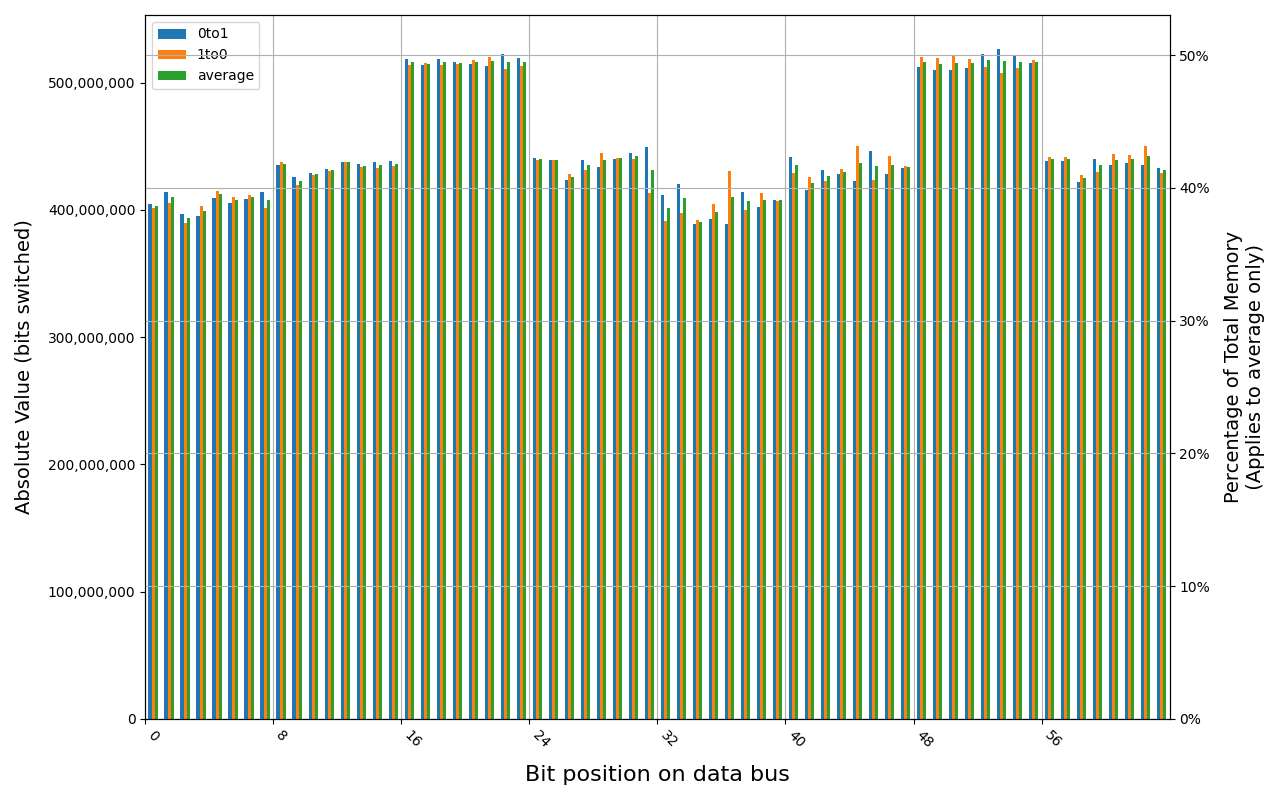
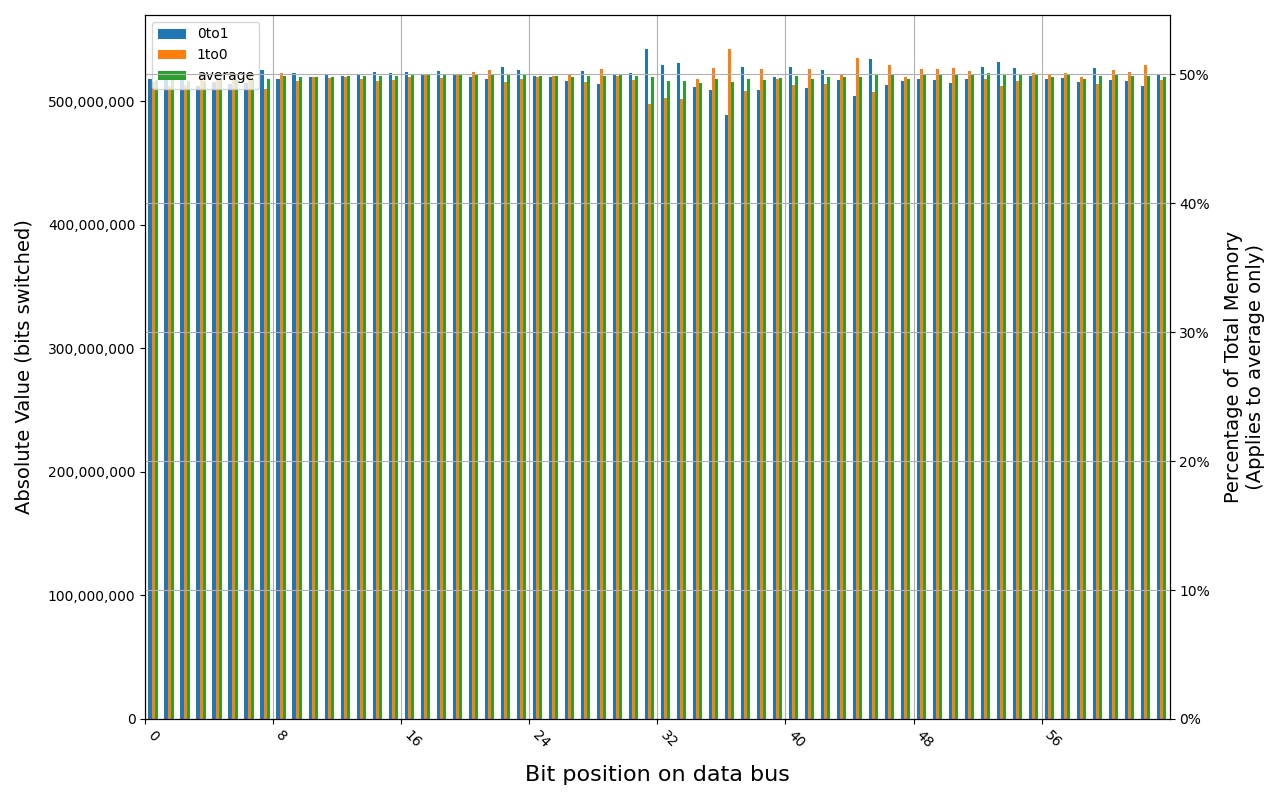
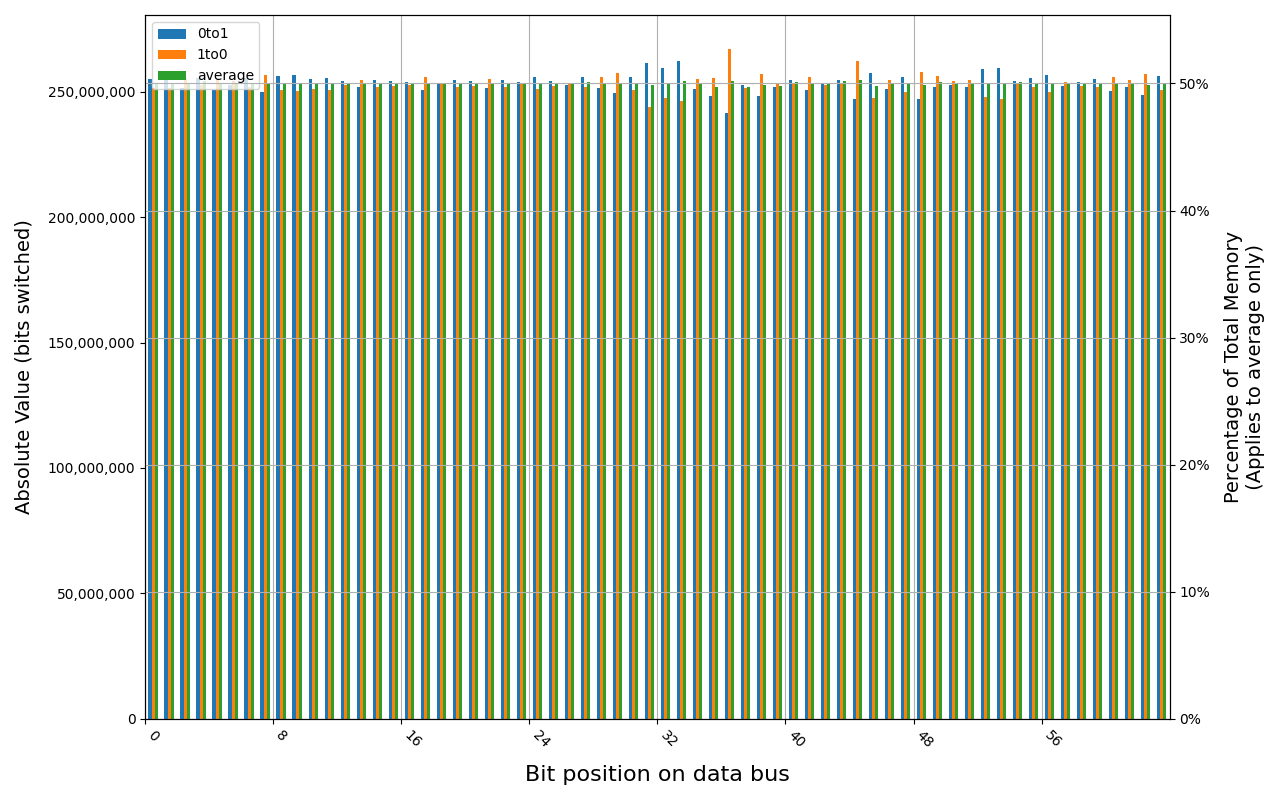
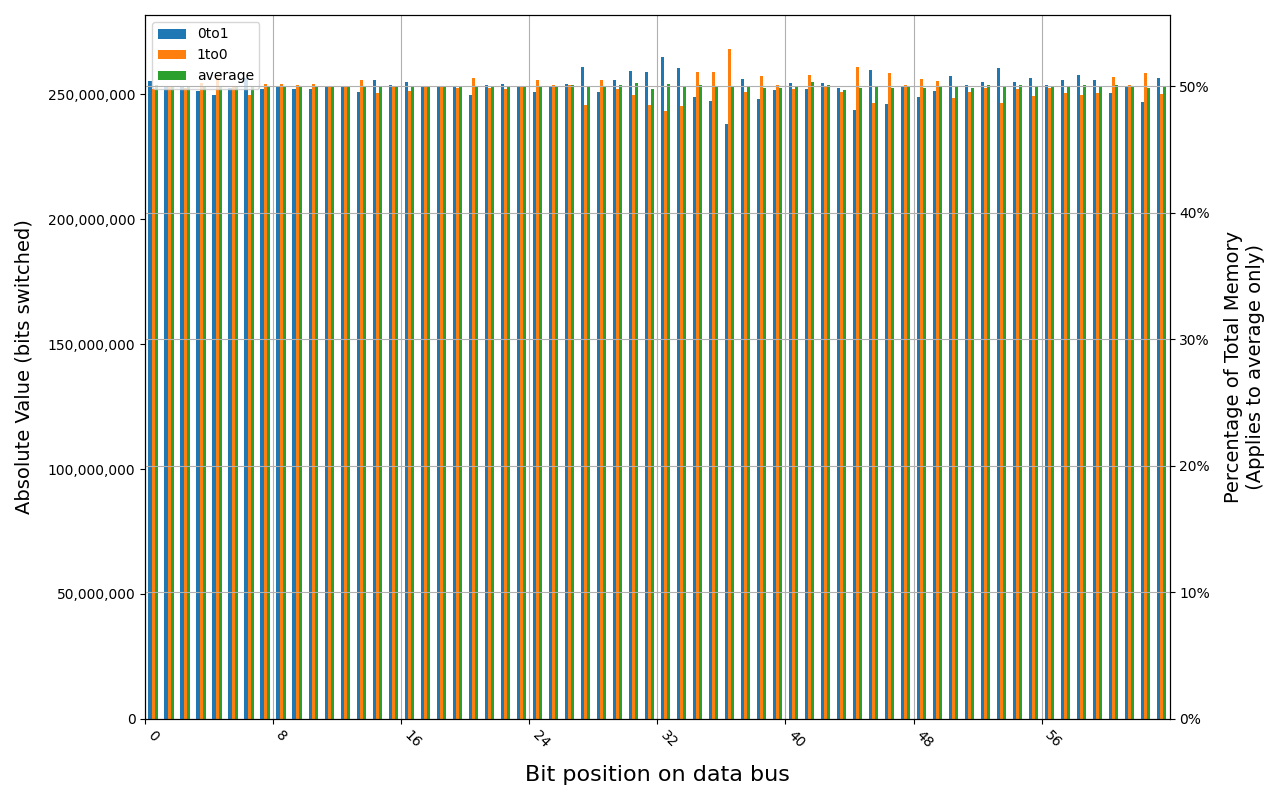
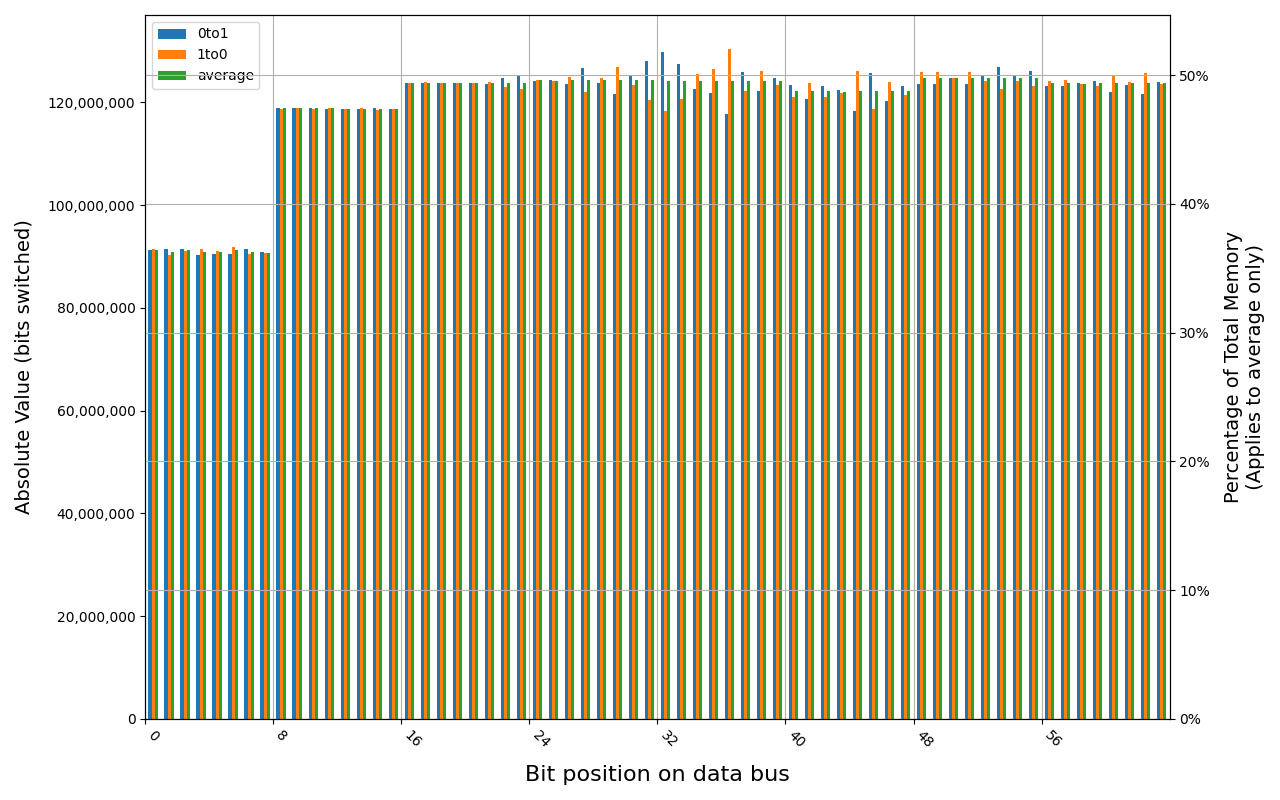
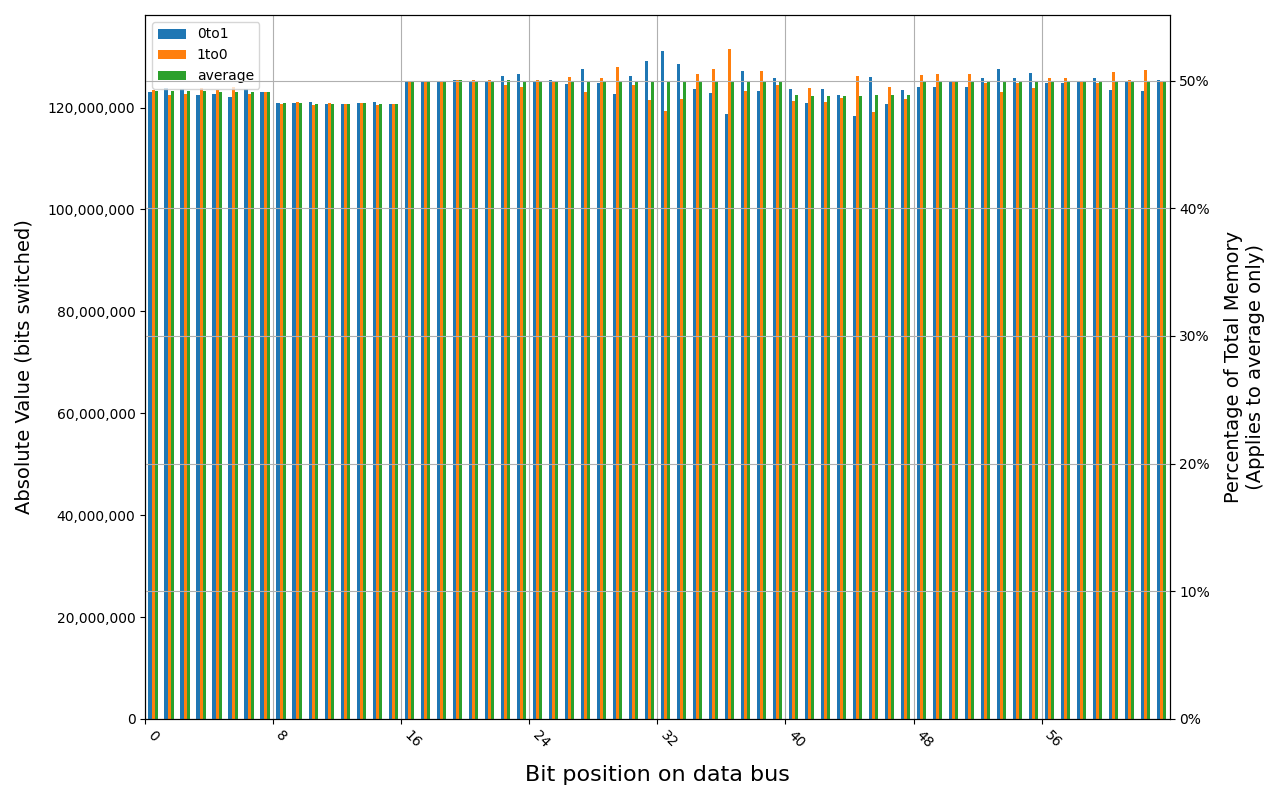
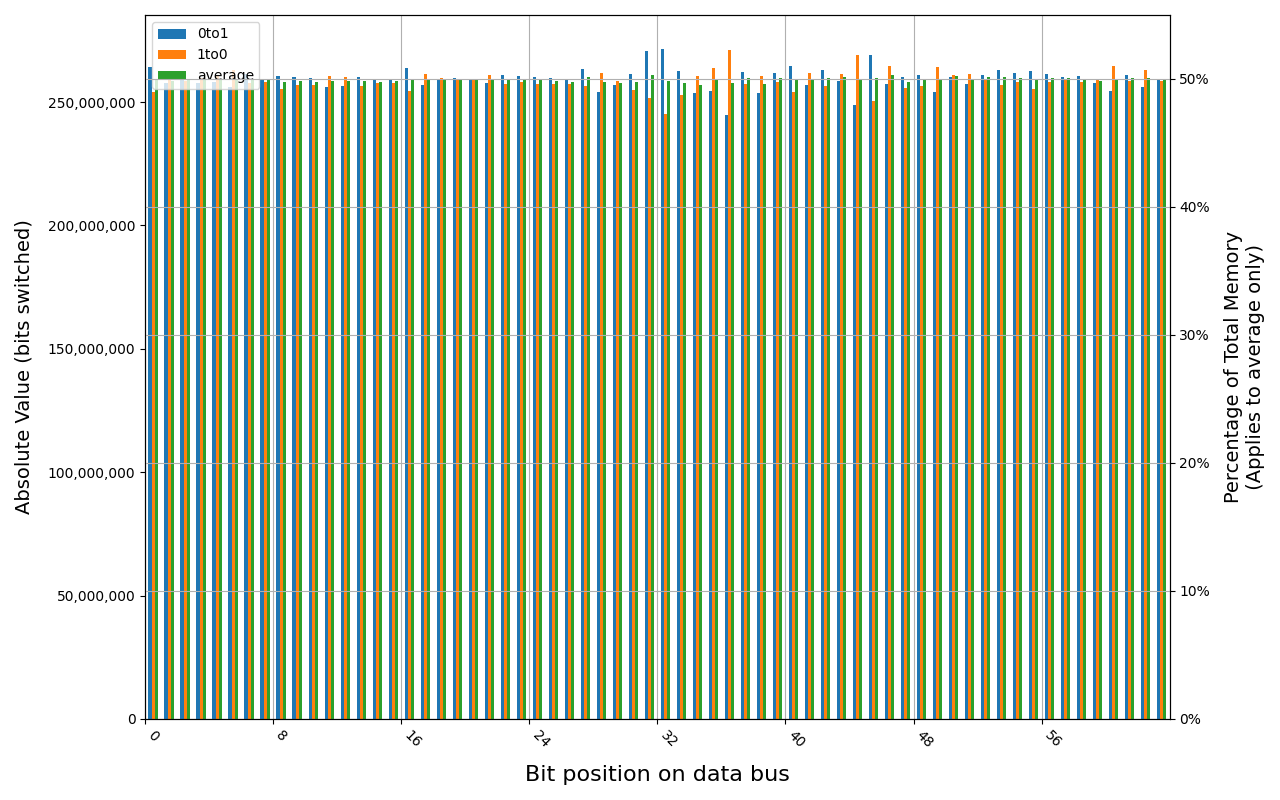
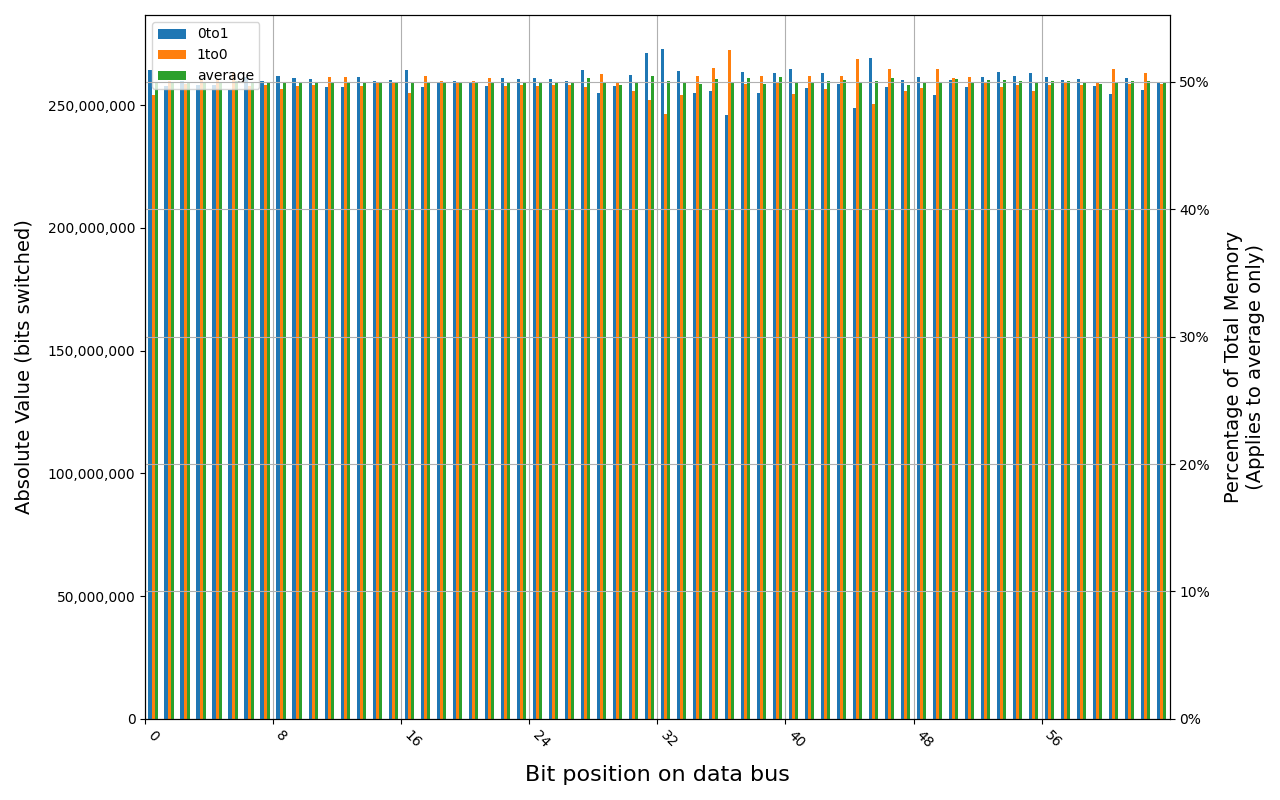
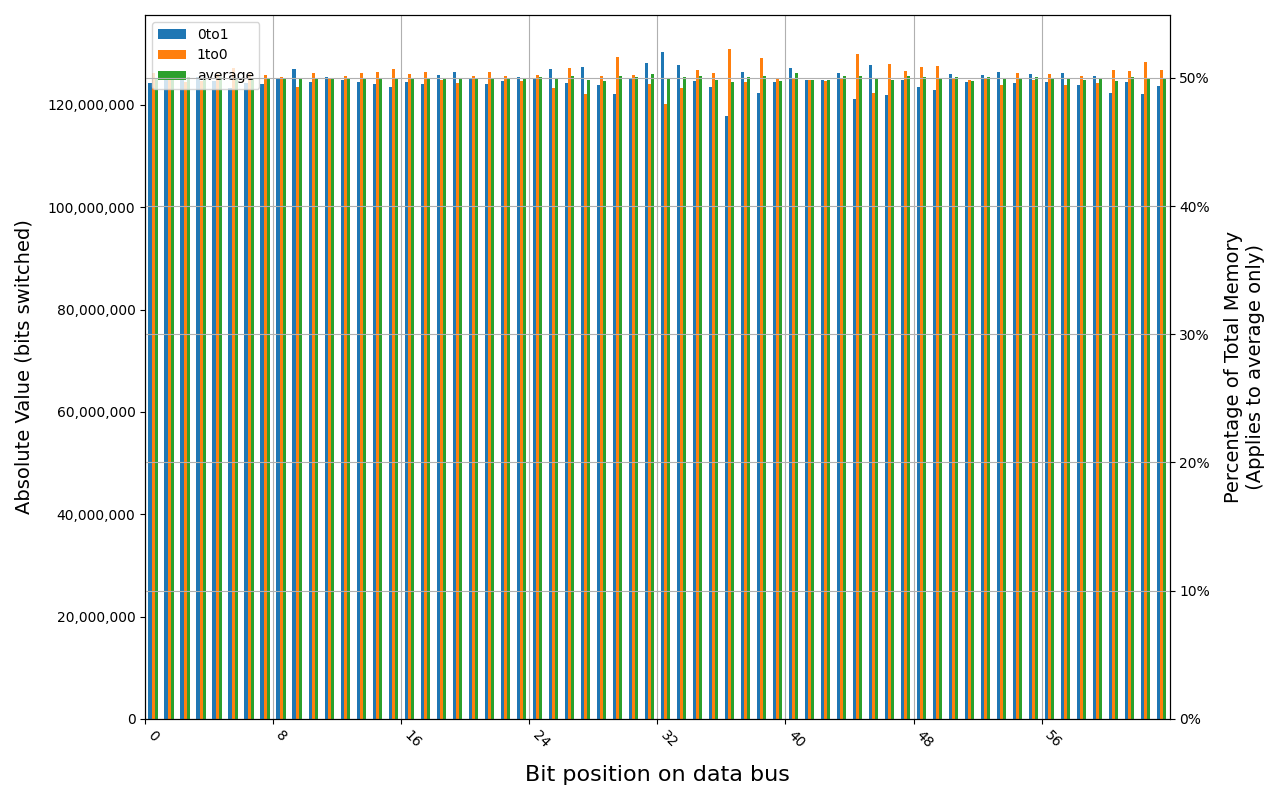
Grouping into slices of 8 bits (or 16 bits in case of 4 GB DDR4 SODIMM) is clearly visible across all tested cases, except for those that show full data loss immediately after power off. In case of DDR5 in laptops, it can be seen that changes on upper and lower 32 bits are mirrored.
There is a visible, consistent disproportion of 1to0 and 0to1 changes,
especially on bits 31-36. It doesn’t depend on module nor platform. There are
few possible explanations:
- Poor LFSR implementation. Some bit patterns may be more common than others.
- Patterns seeded from a physical address of a page. This causes lower 12 bits to be always the same.
- Similar memory address space layout on all x86 platforms. Addresses just below 4 GB are reserved for MMIO, there are also some smaller holes below 1 MB for legacy devices.
- Similar pattern of firmware memory allocations. All of the tested platforms were running coreboot with edk2 payload. This combination allocates memory from the top of available memory in lower 4 GB, which may further expand a hole reserved for MMIO.
What are those numbers about?
The percentages presented in this and previous post describe bit error ratio (BER, not to be confused with bit error rate which uses the same acronym). In our case, they describe ratio of flipped bits to the total number of bits compared. To put it into perspective, examples below show how this impacts the reception of a message for two simple cases: plain text and bitmap graphic.
For The quick brown fox jumps over the lazy dog, messages malformed with different BER values may look like this:
|
|
The results are shown as an output of xxd, as they contain many non-printable
characters. As you can see, even with BER as low as 10% the result is becoming
unintelligible. Even though there are some unchanged letters, without context it
would be very difficult to guess what the original message was. For bigger BER
values, almost all characters are changed. However, this is skewed by how
letters are stored and how human mind perceives similarities between them. In
ASCII encoding, p is as close to P as it is to x, t, r, q, 0 and
few more, not always printable, characters. All of those require just one
swapped bit (have a Hamming distance
of 1), but for human eye they don’t look similar, and for human mind the symbols
perceived have very different meanings.
Perception of graphics is less impacted because decoding of meaning of symbols by human brain doesn’t apply. To reduce the impact of knowing what to look for, these results are presented in reversed order, starting from completely randomized pixel values, moving towards the original image.

Bitmap with BER = 0.5

Bitmap with BER = 0.4

Bitmap with BER = 0.3

Bitmap with BER = 0.2
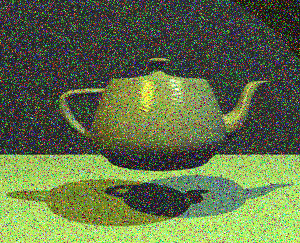
Bitmap with BER = 0.1

Bitmap with BER = 0.0 - original image. By: Finlay McWalter, Public Domain
Note: BER was simulated for pixel data only, and not metadata like image dimensions, pixel format or any possible checksum. Doing so would most likely cause the decoders to detect the file as damaged and refuse displaying it further.
With BER = 50%, all we get is white noise. With 40% error ratio, some edges become visible, but depending on the complexity of the image, this may or may not be enough to recognize the objects. Teapot on images with lower BER values is clearly recognizable, despite the noise.
This also is a good moment to show why 50% is the worst case. With higher error rate, the resulting bits are actually more correlated with the source material, but inverted. For example, image with BER = 95% holds the same amount of data as 5% would, but all the colors are inverted:

Bitmap with BER = 0.95
The same was shown for text with BER = 100%. Even though not a single output character was printable, each byte can be inverted to restore original message without any losses.
Summary
There is no clear limit as to the point after which memory content has “decayed enough”. Some data is easier to recover from partial structures than others. In some cases, like bitmaps shown above, losing some bits is acceptable, and while it degrades the quality of the image, the message stored within can still be recovered. This doesn’t apply to all of the data in memory, in some cases each bit is significant. If the structure has a checksum, it may be used to help with guessing the proper values, but as such checksum would also be susceptible to decay, it isn’t always a reliable solution.
For files that are somehow encoded (e.g. compressed or encrypted), a single error in one data run may potentially break the ability to parse further structures. However, encoded or encrypted data in RAM is rare - it is used to store files on disk, but reading them to memory often converts it to raw, uncompressed and decrypted format.
As was shown, the time for which data is preserved in RAM after the platform is powered down depends on many factors, but in general there should be not enough useful data to recover after about 3 seconds on most of the tested modules. A notable exception is 4 GB Kingston Fury KF432C16BB/4, where similar level of memory content loss was measured after about a minute. Interestingly, such results weren’t reproduced for other DDR4 modules, even from the same vendor.
All of the series were performed once. Ideally, they should be repeated few times for each configuration to rule out random measurement errors. This wasn’t possible partially due to variations in ambient temperature that were outside of our control, especially over longer periods of time that were required to get full set of data. We could also repeat some tests for different units of the same model of memory modules.
Unlock the full potential of your hardware and secure your firmware with the
experts at 3mdeb! If you’re looking to boost your product’s performance and
protect it from potential security threats, our team is here to help.
Schedule a call with us
or drop us an email at contact<at>3mdeb<dot>com to start unlocking the hidden
benefits of your hardware. And if you want to stay up-to-date on all things
firmware security and optimization, be sure to sign up for our newsletter: